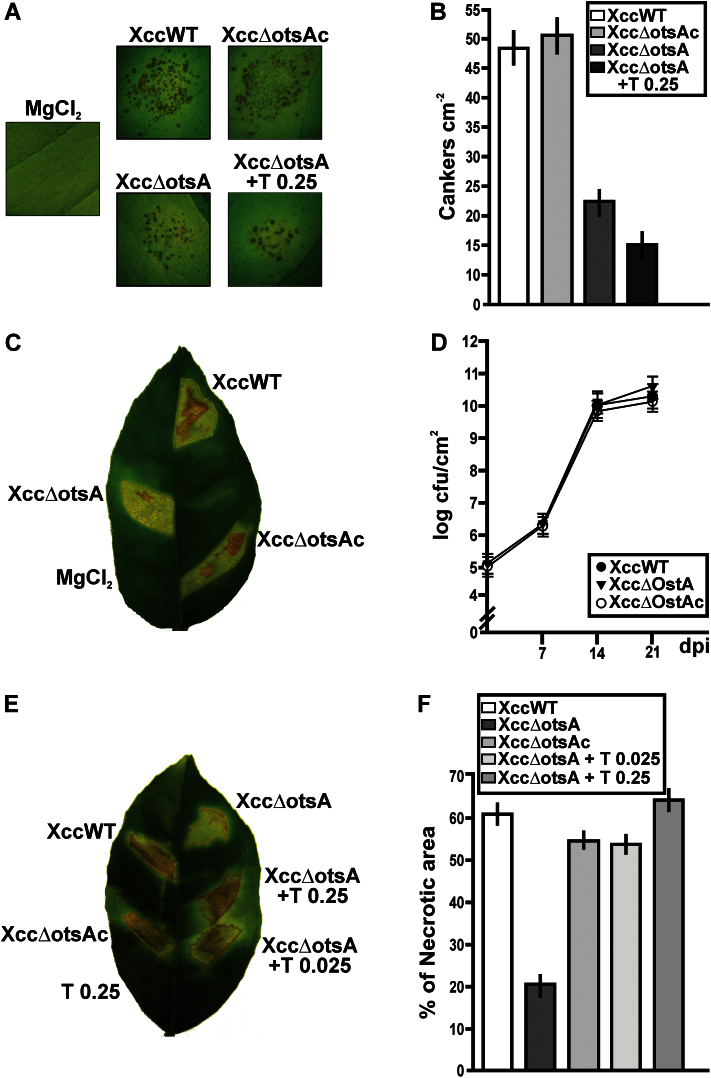
Fig. 4.
Analysis of the symptoms caused by XccWT, Xcc∆otsA, and Xcc∆otsAc in infiltrated citrus leaves. (A) The strains were inoculated at 103 cfu ml–1 into the intercellular spaces of fully expanded leaves. The Xcc∆otsA mutant was also co-infiltrated with 0.25mg ml–1 of trehalose. Representative leaves of each infection are shown at 15 dpi. (B) Quantification of cankers cm–2 of infiltrated tissues of the leaves infiltrated as in (A). Bars are the means of 15 citrus leaves infiltrated with each strain. Error bars show the standard deviation. (C) Strains were inoculated at 107 cfu ml–1 into the intercellular spaces of citrus leaves. A representative leaf is shown at 14 dpi. (D) Quantification of the population size of the strains inoculated in citrus leaves as described in (C). Values are the means of log cfu cm–2 of infiltrated tissues obtained from 15 infiltrated citrus leaves at different dpi. Error bars show the standard deviation. (E) A representative leaf of XccWT, Xcc∆otsAc, and Xcc∆otsA infections with co-infiltration of the Xcc∆otsA mutant with 0.025 and 0.25mg ml–1 of trehalose (T) at 14 dpi. (F) Quantification of the necrotic areas of the leaves infiltrated as in (C) and (E). Bars are the means of the percentages of necrotic areas for each strain from 15 infiltrated citrus leaves. Error bars show the standard deviation. The data were analysed for statistical differences by one-way ANOVA (P<0.05). (This figure is available in colour at JXB online.)

