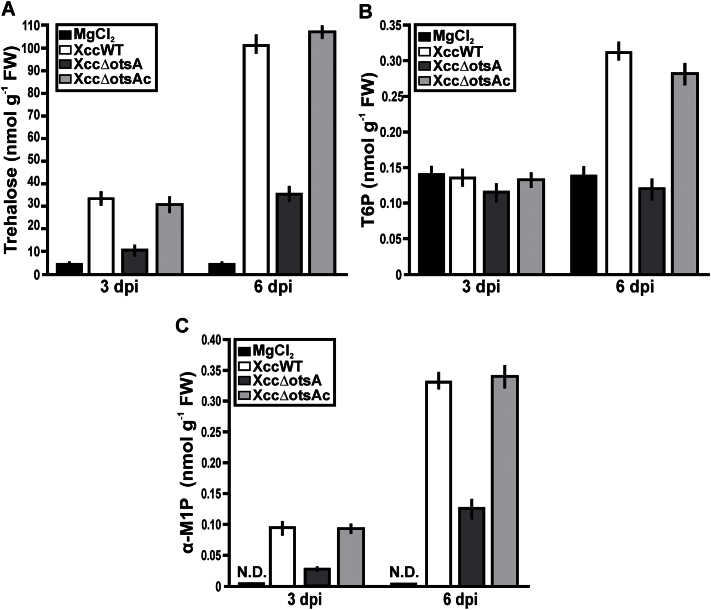
Fig. 6.
Quantification of trehalose, T6P, and α-M1P in leaves infected with XccWT, Xcc∆otsA, and Xcc∆otsAc strains. The leaves were infiltrated with the strains at 107 cfu ml–1 and 10mM MgCl2, and after 3 and 6 dpi, quantification of trehalose (A), T6P (B), and α-M1P (C) as nmol g–1 of fresh weight (FW) of infiltrated tissue was performed. Bars are the means of the values of five infiltrated leaves with each strain at each time. Error bars show the standard error. N.D., not detected. Data were statically analysed by one-way ANOVA (P<0.05).

