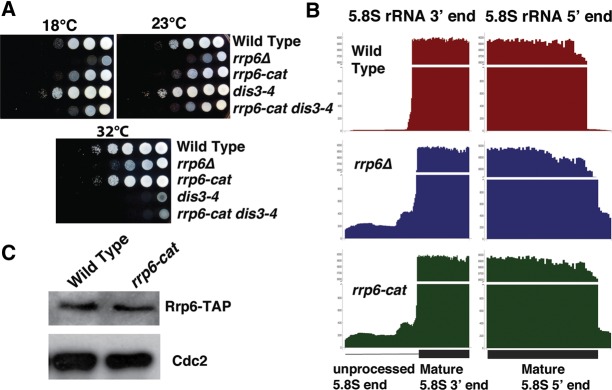
FIGURE 1.
Phenotypes of Rrp6 and Dis3 mutants. (A) Growth assay for rrp6 and dis3 mutants on YES media at different temperatures. (B) Bar chart showing RNA-seq reads at one 5.8S rRNA locus (SPRRNA.51) at the 5′ and 3′ ends (direction of transcription is from right to left). The y-axis was compressed to clearly show the unprocessed reads. (C) Western blot showing the levels of Rrp6-TAP (strain JLP1840) and Rrp6-cat-TAP (strain JLP1841).

