
FIGURE 3.
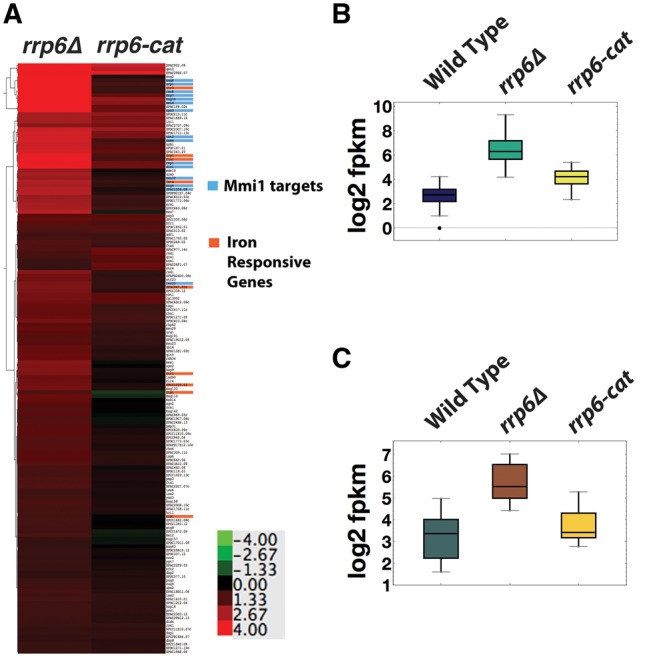
RNA accumulation of Rrp6 target mRNAs in rrp6 deletion and catalytic mutants. (A) Hierarchical clustering of the log2 (mutant/WT) FPKM ratio of the 157 Rrp6 target mRNAs, in rrp6Δ and rrp6-cat. Mmi1 target RNAs are highlighted in blue and iron homeostasis mRNAs are highlighted in orange. (B) Median log2 FPKM values for Mmi1 target mRNAs and (C) iron response mRNAs in wild-type and rrp6 mutants.