FIGURE 5.
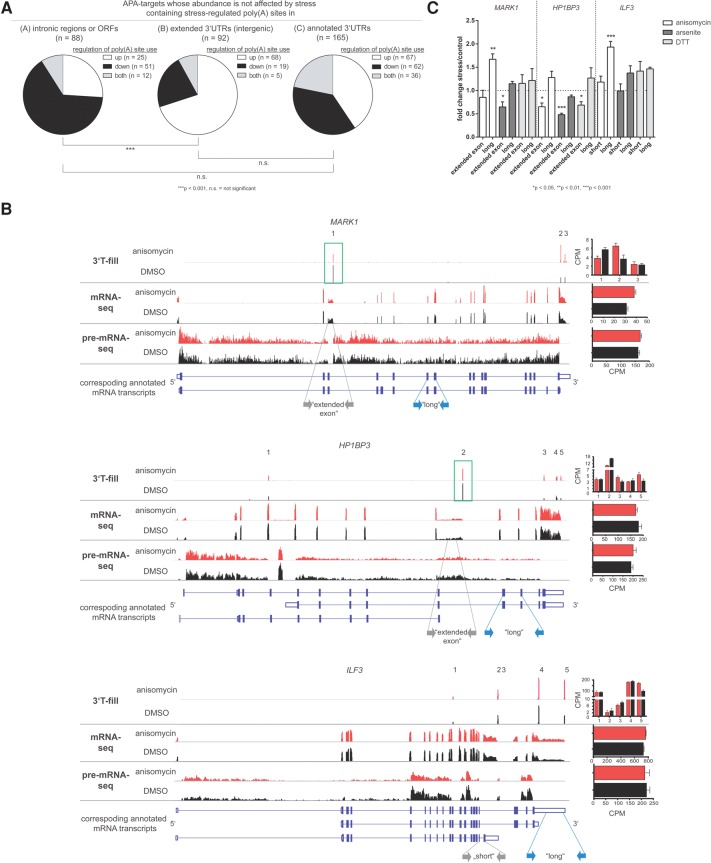
Stress-induced APA regulates the length of the ORF of genes whose mRNA abundance is not affected by stress treatment. (A) Pie charts displaying the proportion of genes with stress-dependently regulated poly(A) sites in (A) intronic regions or ORFs, (B) intergenic regions (extended 3′UTRs), or (C) annotated 3′UTRs among the APA targets that do not change in overall gene expression in stress. Genes may be included in more than one category if possessing multiple stress-regulated poly(A) sites in different genomic regions. Genes containing poly(A) sites which showed an increased usage are depicted in white, those containing poly(A) sites which showed a decreased usage are shown in black, and those containing both are shown in gray. χ2 test was applied to calculate P-values. (B) IGV browser data displaying the 3′T-fill, mRNA- and pre-mRNA-seq data for the genes MARK1 (upper panel), HP1BP3 (middle panel), and ILF3 (lower panel) in stress (red) and control conditions (black). The 3′T-fill lanes show poly(A) sites used under stressed (anisomycin) and unstressed (DMSO) conditions. Detected poly(A) sites are numbered. Poly(A) sites corresponding to previously not annotated isoforms are highlighted with green boxes. The mRNA-seq lanes display the expression of poly(A)+ mRNA and the pre-mRNA-seq lanes the expression of intronic regions. The bar diagrams on the right display the 3′T-fill expression data for individual poly(A) sites (upper panel) and the quantification of total mRNA (middle panel) or pre-mRNA levels (lower panel) as obtained in mRNA- and pre-mRNA-seq sequencing analyses. The bottom lanes schematically represent the mRNA transcripts of the respective genes as provided by Ensembl 73 with coding exons as filled boxes, 3′UTRs as open boxes, and introns as lines. The gray and blue arrows indicate the primers for the short isoform of ILF3, the isoforms with an “extended exon” of MARK1 and HP1BP3 or the annotated “long” isoforms that were used in the qRT-PCR displayed in panel C. (C) qRT-PCRs on cells treated with anisomycin, arsenite, or DTT using primers specific for the annotated “long” or “short” isoforms or the isoforms with an “extended exon” (see panel B) of the genes MARK1, HP1BP3, and ILF3. Data were normalized to unstressed cells and GAPDH. Bars represent mean + SEM, n = 3. Two-sided Student's t-test was applied to calculate P-values.

