
FIGURE 1.
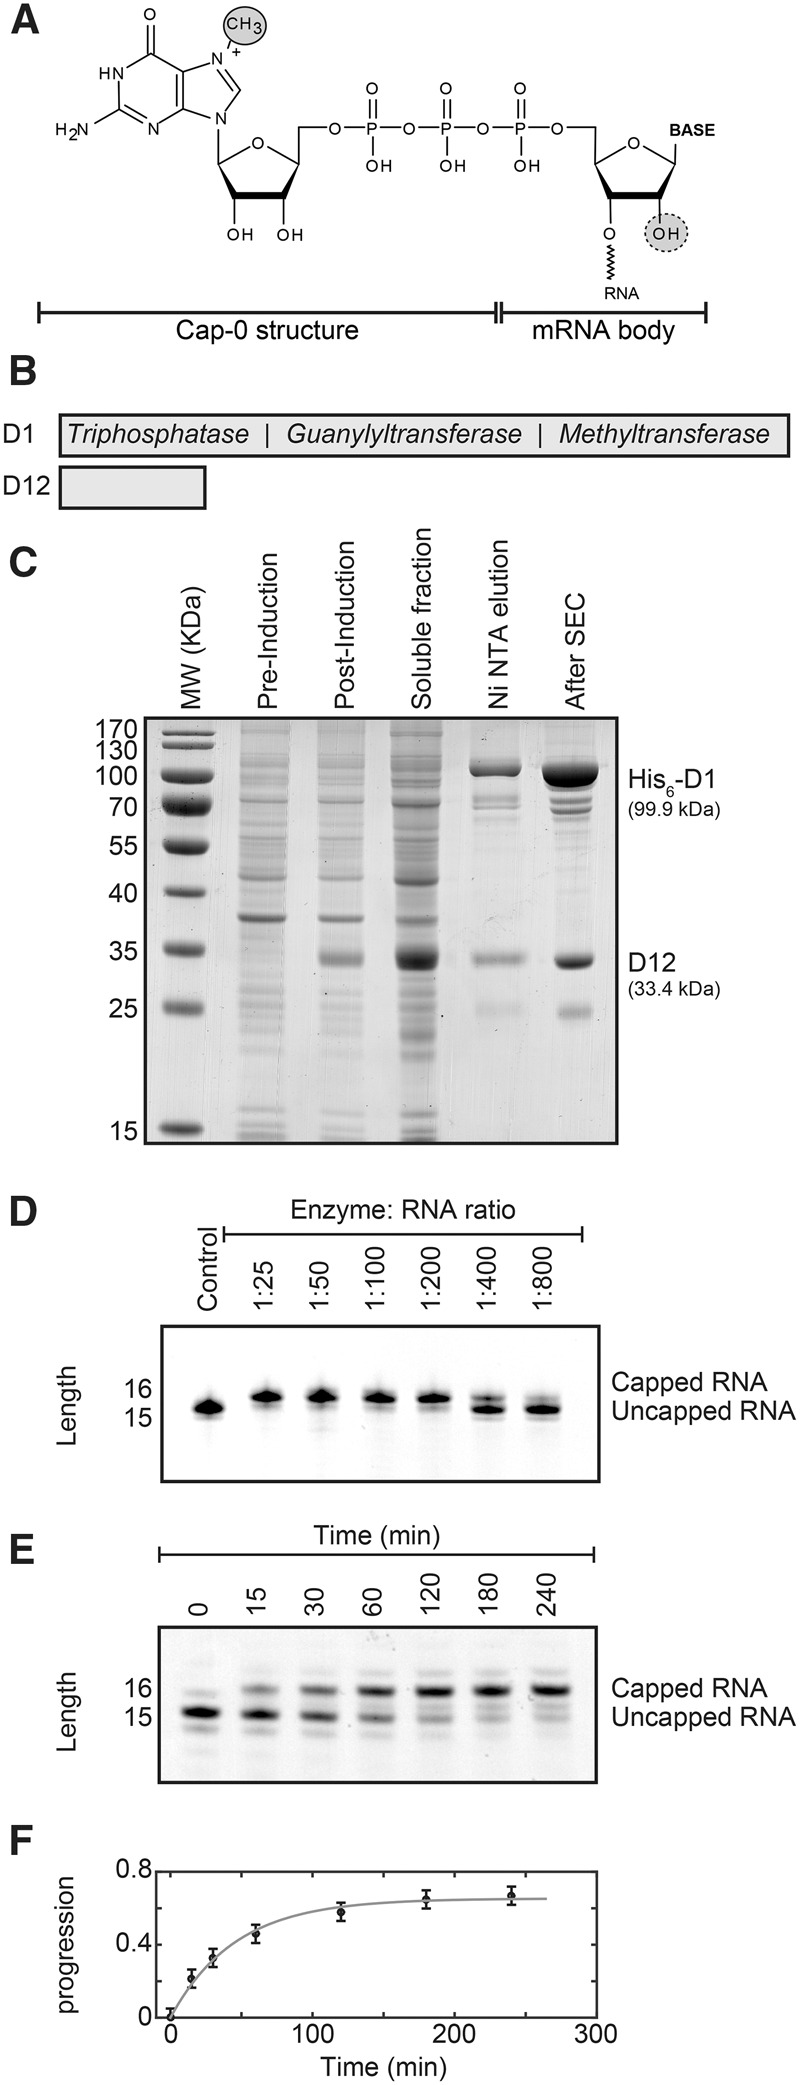
Purification and activity of the vaccinia virus capping enzyme. (A) Structure of the mRNA cap-0. The N7-methyl group in the cap structure is circled. The ribose 2′-OH group that is methylated to yield the cap-1 structure is indicated with a dashed circle. (B) Schematic representation of the vaccinia virus capping enzyme complex that contains the D1 protein with the catalytically active sites and the D12 protein that stabilizes the D1 protein. The D1 protein contains three activities: First, the triphosphatase activity hydrolyzes the RNA 5′ triphosphate into a 5′ diphosphate and inorganic phosphate. Second, the guanylyltransferase activity transfers GMP from GTP onto the 5′ end of the diphosphate RNA. In this step, the 5′-5′ triphosphate bond is formed and pyrophosphate is released. Finally, the methyltransferase activity uses SAM (S-adenosyl methionine) as a methyl donor to methylate the guanine N7 position. (See also Supplemental Fig. 1). (C) Overexpression and purification of the vaccinia virus capping enzyme. The designed plasmid contains the DNA of the D1 and D12 proteins that are codon optimized for overexpression in Escherichia coli (Supplemental Fig. 2). Shown are the E. coli cells before induction of protein expression (pre-induction) and after overexpression of the enzyme complex for 12 h (post-induction), the soluble fraction and the protein after Ni-NTA affinity purification (Ni NTA elution), and the final enzyme complex after size exclusion chromatography (After SEC). Note that the expression of the stabilizing D12 protein is higher than that of the D1 enzyme. The excess of the D12 protein is removed during Ni-NTA purification as only the D1 protein contains an affinity tag. The yield of the purification is ∼12 mg of pure enzyme complex from 5 L of E. coli culture. (D) The purified complex possesses a high mRNA capping activity. Shown are capping reactions with different enzyme:RNA ratios after 1 h incubation time. The capping reaction can be easily followed using Urea-PAGE analysis as the capping reaction adds one base to the RNA substrate. The optimal ratio varies slightly depending on the substrate RNA and should be determined using small-scale capping reactions. (E) To obtain insights into the kinetics of the capping reaction, an uncapped RNA was incubated with a low amount of capping enzyme (1:750). The RNA is capped to a larger degree after longer (>1 h) incubation times. (F) Quantification of the capping reaction shown in E. The solid gray line is a fit of the progression of the reaction [where the progression is defined as capped/(capped + uncapped) RNA] to the experimental data. From the initial slope of the progression curve we extract that the enzyme can cap 16 RNA substrates per minute. The rate of the capping reaction drops over time due to the loss of activity of the enzyme after incubation times that are longer than 1 h.