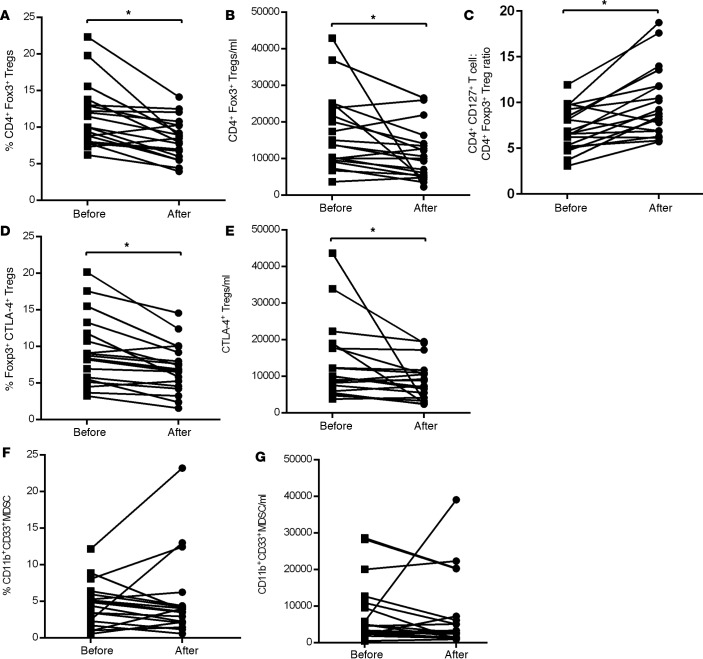
Figure 2. Decrease in Tregs and MDSCs after sorafenib therapy in HCC patients.
(A) Frequency and (B) absolute numbers of CD4+Foxp3+ Tregs in the peripheral blood of HCC patients. (C) Ratio of CD4+CD127+ T cells to CD4+Foxp3+ T cells (CD4+CD127+/CD4+Foxp3+ T cells). (D) Frequency and (E) absolute numbers of Foxp3+CTLA-4+ Tregs in HCC patients. (F) Frequency and (G) absolute numbers of MDSC in HCC patients. Each symbol represents an individual HCC patient before or after sorafenib treatment. Frequencies of Tregs and T effector cells were calculated based on CD3+CD4+ T cell population and MDSC based on CD14–HLA-DR– population. n = 19, * P < 0.05, permutation paired t test.

