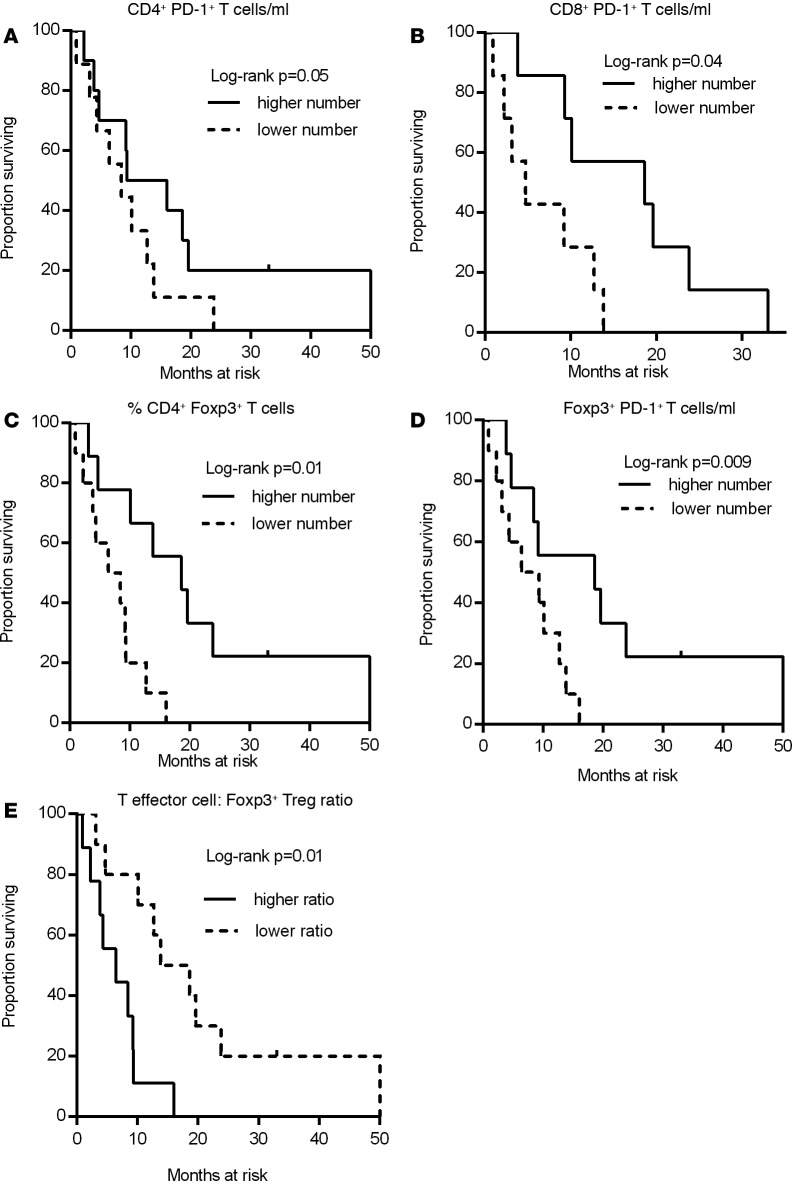
Figure 5. Kaplan-Meier plots showing the predictive immune correlates of response to sorafenib treatment in HCC patients.
Plots A–E show the correlation between immune parameters before sorafenib treatment and patient outcome. The association between immune markers and OS was calculated as described in Methods. (A) Absolute numbers of CD4+PD-1+ T cells; median = 28.05. (B) Absolute numbers of CD8+PD-1+ T cells; median = 18.27. (C) Frequency of CD4+ Foxp3+ T cells; median = 10.0. (D) Absolute numbers of CD4+Foxp3+ T cells; median =13.84. (E) CD4+CD127+ T effector cell/CD4+ Foxp3+ T cell ratio; median = 6.58.

