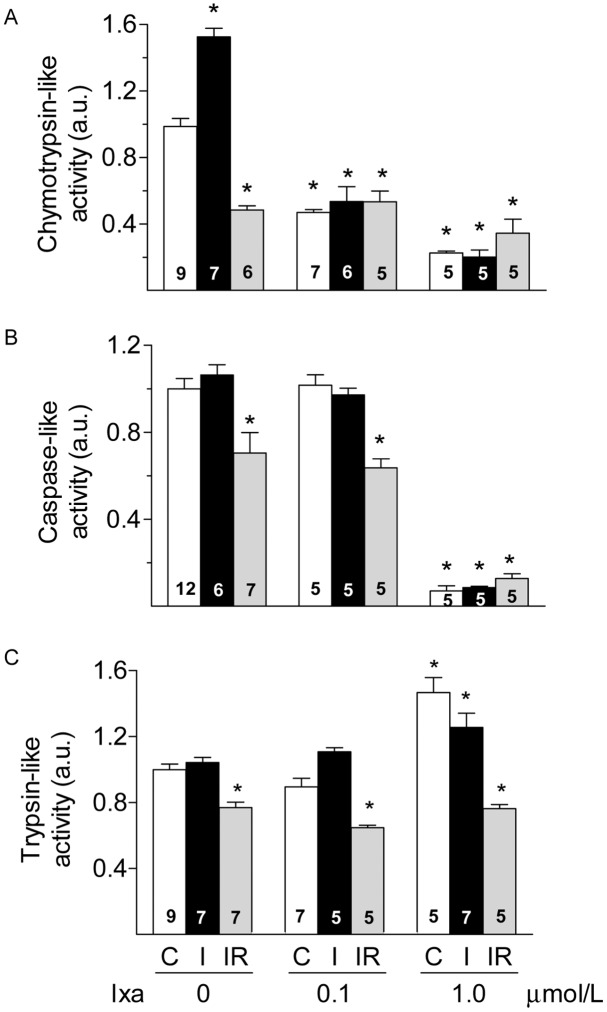
Fig 3. Proteasome activities after I or IR.
Chymotrypsin-like (panel A), caspase-like (panel B) and trypsin-like (panel C) activities of the proteasome are shown in controls (C, white bars), after 30 min of ischemia (I, black bars) or after 30 min of ischemia followed by 60 min of reperfusion (IR, grey bars) in hearts perfused with the indicated concentration of ixazomib. Activities were normalized with respect to controls. Bars show the mean ± S.E.M. of different hearts as indicated in each bar. *p< 0.05 vs C without inhibitor.

