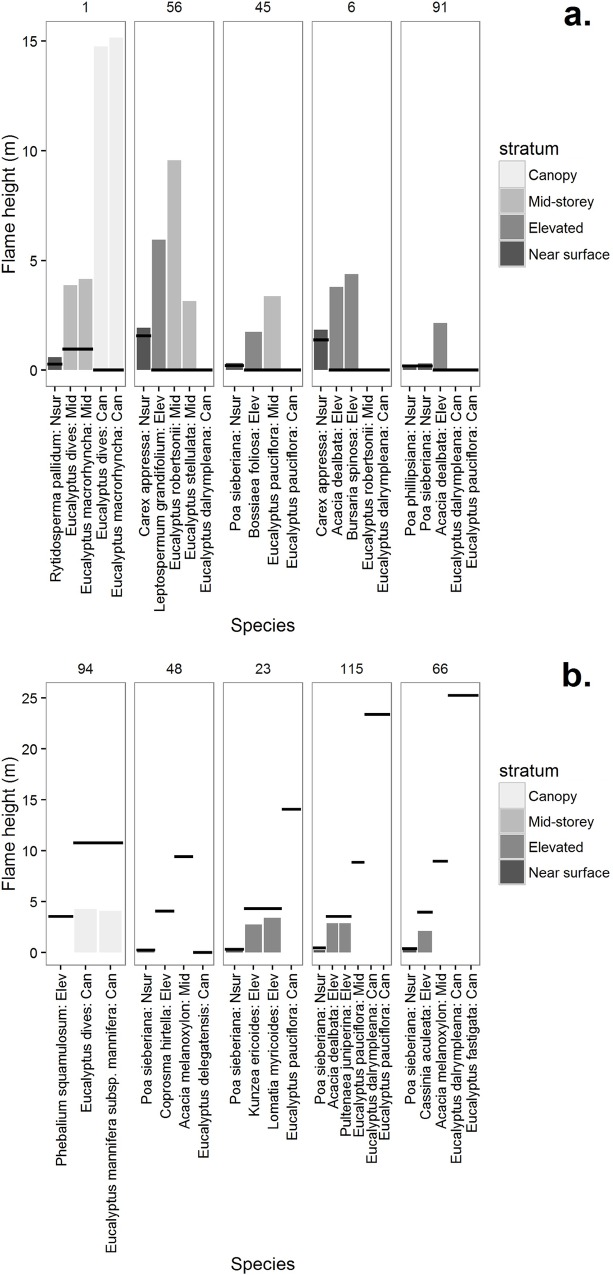
Fig 7. Donor flame height per species, stratum and site.
Showing the five sites where the difference in prediction (FSL—FS) was most positive (a), and the five sites where it was most negative (b). Grey bars show flame heights per species from FSL and horizontal lines show flame heights from mean species in FS. Sites are ordered by delta flame height and the site number is given at the top of each plot.

