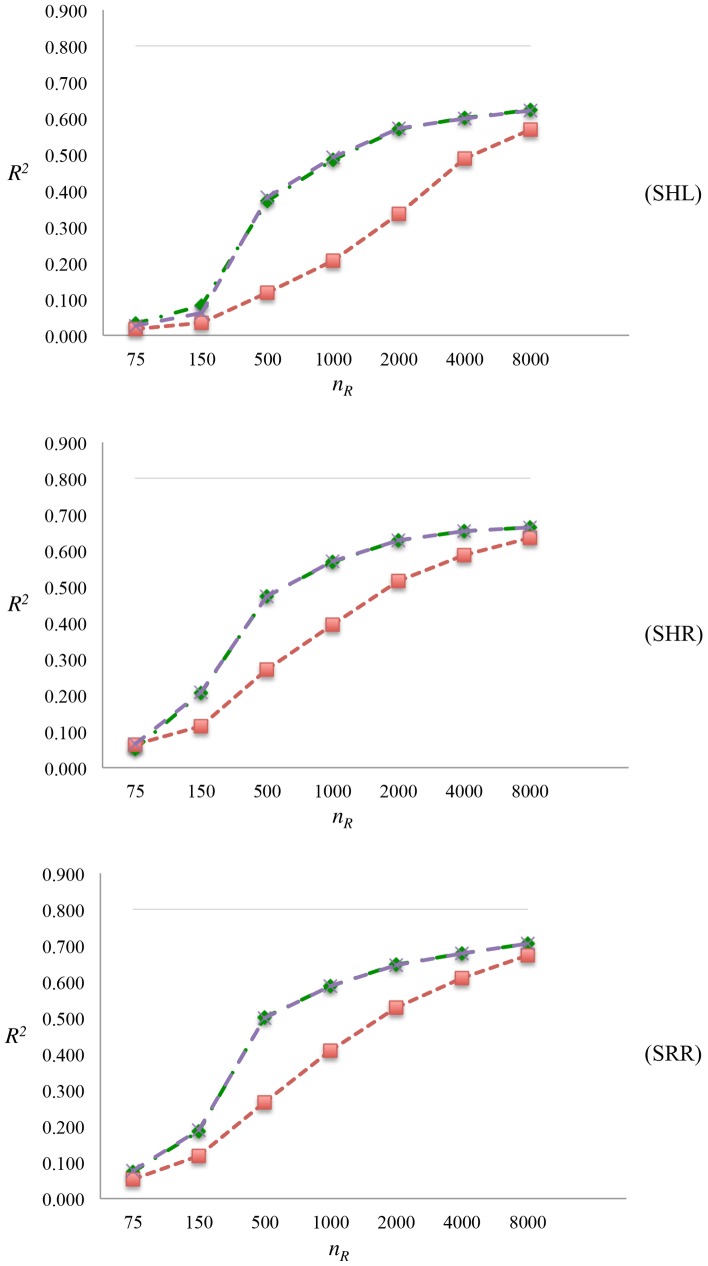
Fig 2. Comparison of different methods.
SHL: Markers and QTL were selected for high and low MAFs, respectively; SHR: Markers were selected for high MAF, whereas QTL were selected at random; SRR: Markers and QTL were selected at random; nR: number of individuals in RP; R2: squared correlation between y and ; simulated heritability, , (grey line); prediction R2s of GBLUP (red line), BayesB (green line) and BayesC (purple line).

