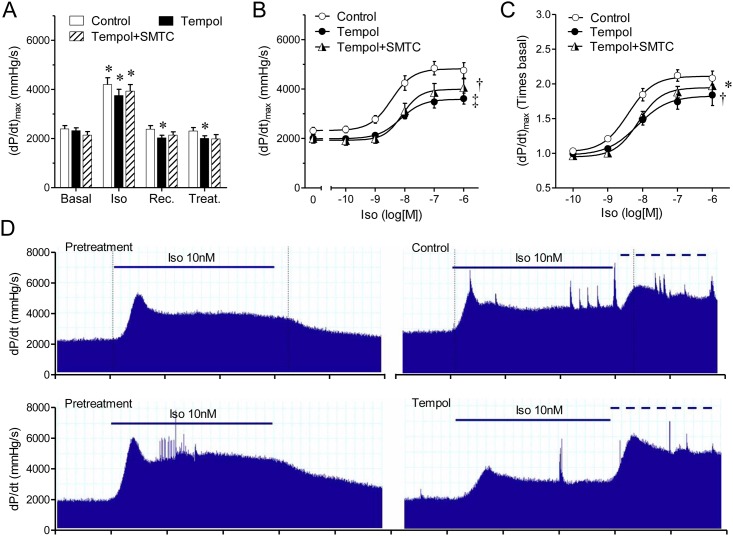
Fig 7. Inhibition of the nitrosylation reaction with tempol, a radical scavenger, reduces the inotropic response to β-adrenergic stimulation.
(A) Contractility (dP/dtmax) determined consecutively under basal conditions (Basal), isoproterenol stimulation (Iso); recovery (Rec.), and treatment (Treat.) with vehicle (Control, n = 12), tempol 100μM (Tempol, n = 9), or tempol 100μM plus NOS-1 inhibitor SMTC 300nM (Tempol+SMTC, n = 6), details as in Fig 1. Asterisk indicates p<0.05 vs. Basal (paired t test, with Dunnett’s modification). (B) Concentration-response curves to isoproterenol alone (Control), in the presence of tempol, and tempol plus SMTC. (C) Same data as in panel B, expressed as relative values, corrected by the corresponding contractility values after treatment with inhibitor or inhibitors. * p<0.05, † p<0.01, ‡ p<0.001 vs. Control curve (Best fit ANOVA, the difference resided only in the top value; bottom and EC50 parameters were shared). (D) Representative records showing contractility changes (dP/dt) elicited by the application of Iso10nM (solid line) before and after treatment (control or tempol). The dashed line indicates application of 100nM Iso as part of the dose-response curve.

