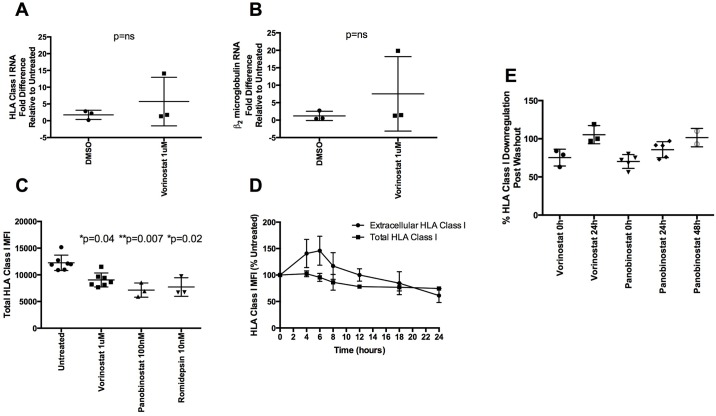
Fig 2. Mechanism of HLA class I down-regulation.
(A, B) Fold up-regulation of HLA class I and β2 microglobulin RNA, respectively, by qPCR of DMSO and 1uM vorinostat treated samples normalized to untreated controls. All amounts were normalized to 18S copies (n = 3). A Mann-Whitney U test used to compare levels of mRNA expression. C) MFI of total levels (after cell permeabilization) of HLA class I after 24h of culture with HDACi-free media (n = 7), 1uM vorinostat (n = 7), 100nM panobinostat (n = 3) and 10nM romidepsin (n = 3). A Kruskal Wallis test with Dunn’s test for multiple comparisons was performed. D) Kinetics of extracellular and total levels of HLA class I are shown. Extracellular and total values were calculated as a percentage of their respective 0h timepoint MFI (n = 3). E) Cells were treated with 1uM vorinostat or 100nM panobinostat for 24h. Cells were then either washed 3 times or left alone and cultured until HLA class I levels matched untreated controls. Times shown are post wash. Percent down-regulation of HLA class I compared to untreated controls is shown for vorinostat (n = 3) and panobinostat (n = 5).

