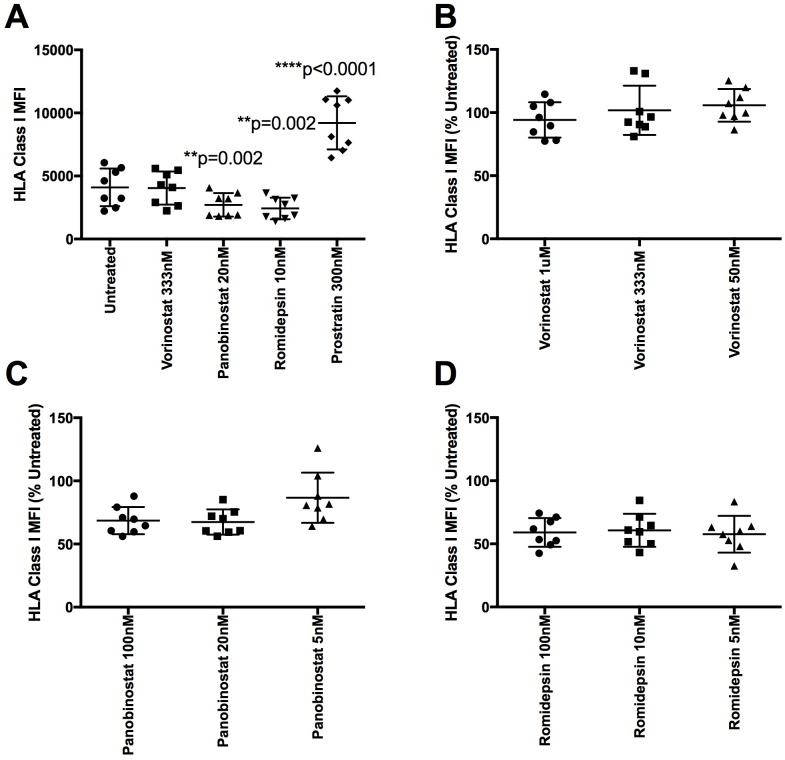
Fig 3. HDACi down-regulate HLA class I expression in patient samples.
Fresh CD4 T cells from eight ART treated patients were treated for 24 hours with vorinostat (1uM, 333nm and 50nM), panobinostat (100nM, 20nM, and 5nM), romidepsin (100nM, 10nM, and 5nM) or 300nM prostratin. A) Median fluorescent intensity (MFI) values after treatment with clinically relevant doses are shown. A repeated measures one-way ANOVA with a Greenhouse-Geisser correction with Dunnett’s multiple comparison test was performed. B-D) MFI values reported as a percent reduction compared to untreated levels for vorinostat, panobinostat, and romidepsin dilution series, respectively.

