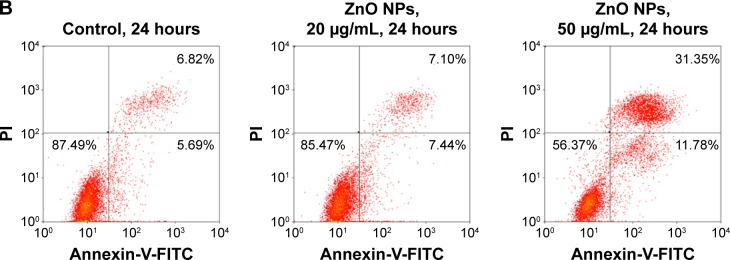
Figure 7.
ZnO NPs induced HaCaT cell apoptosis.
Notes: (A) Scanning electron microscopy images of HaCaT cell topography after exposure to ZnO NPs for 24 hours at different concentrations. The normal HaCaT surface was covered by abundant microvillus, whereas after exposure to ZnO NPs, the microvillus was decreased significantly. Compared to normal HaCaT cells, the apoptotic body appeared (white arrows) on the surface of treated cells. Scale bars =10 μm. (B) Flow cytometry results of Annexin-V-FITC and PI assay. HaCaT cells were treated without (control) or with ZnO NPs (20 or 50 μg/mL) for 24 hours. A cell stained by Annexin-V-FITC− and PI− is shown in the lower left area, one stained by Annexin-V-FITC+ and PI− is shown in the lower right area, one stained by Annexin-V-FITC− and PI+ is shown in the upper left area, and one stained by Annexin-V-FITC+ and PI+ is shown in the upper right area.
Abbreviations: ZnO NPs, zinc oxide nanoparticles; FITC, fluorescein isothiocyanate; PI, propidium iodide.


