Figure 2.
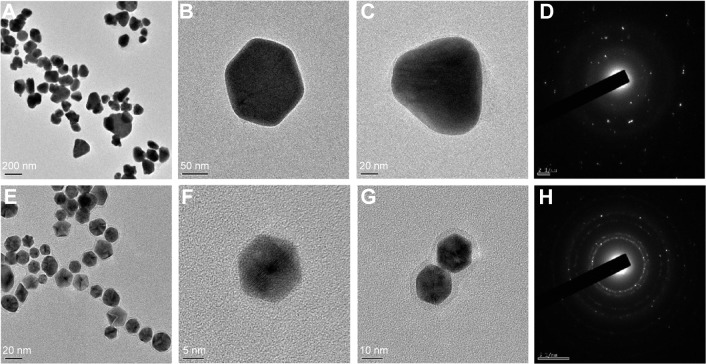
FE-TEM analysis of D-AgNPs and D-AuNPs.
Notes: TEM image of D-AgNPs in which the scale bar represents 200 nm (A), high-resolution image of a single nanocrystal at 50 nm (B) and 20 nm (C), SAED pattern (D). TEM image of D-AuNPs in which the scale bar corresponds to 20 nm (E), high-resolution image of a single nanocrystal at 5 nm (F) and 10 nm (G), and SAED pattern (H).
Abbreviations: TEM, transmission electron microscopy; SAED, selected area electron diffraction; D-AgNPs, Dendropanax silver nanoparticles; D-AuNPs, Dendropanax gold nanoparticles.

