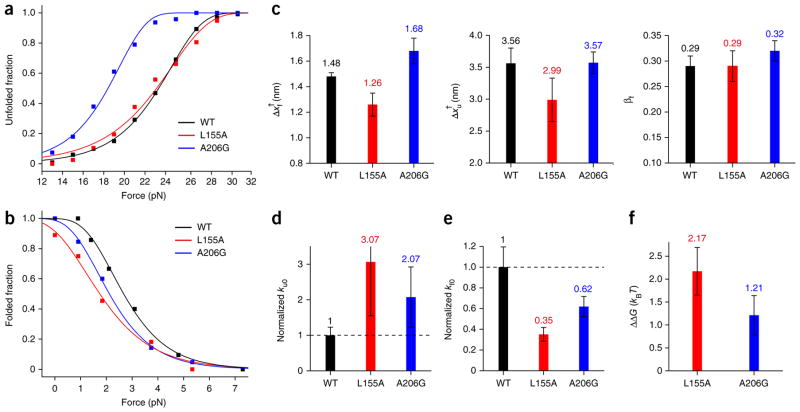
Figure 4. Comparison of kinetic and thermodynamic properties between WT and mutant GlpG.
(a,b) Unfolded fraction (a) and folded fraction (b) as a function of force for the WT and mutant GlpG proteins. The total number of unfolding and refolding events are n = 233 and n = 125 for WT; n = 77 and n = 58 for the L155A mutant; and n = 95 and n = 87 for the A206G mutant. Fitting the data (Online Methods) yields kinetic rates for unfolding and folding at zero tension (ku0 and kf0) and distances from the folded (and unfolded) state to the transition state (Δxf† and Δxu†). (c) Comparison of the distance values (left, Δxf†; middle, Δxu†) and the transition state positions (right, βf) of the WT and the mutants. (d,e) Comparison of the unfolding rate (d) and refolding rate (e) for the WT and mutant proteins, normalized to the WT rate. (f) The change in unfolding free energy of the mutants relative to the WT observed in forced unfolding experiments (ΔΔG = ΔGWT − ΔGmutant). All error bars represent s.e.m.

