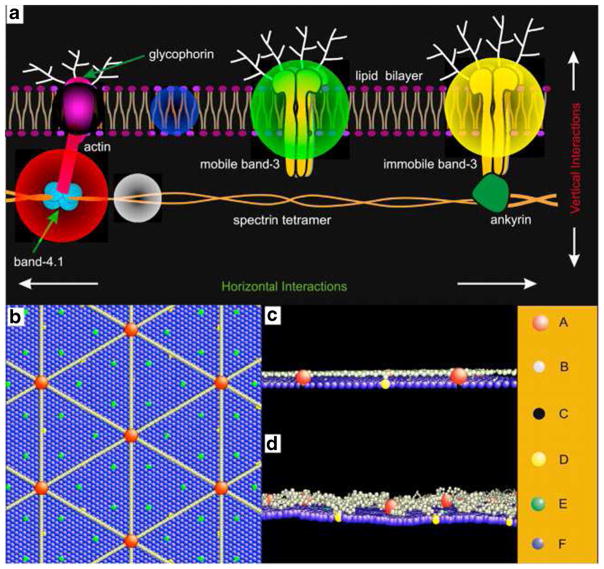
Fig. 11.
a Schematic of the human RBC membrane. b–d A mesoscale detailed membrane model. b, c show the initial configuration of the cell membrane from the top view (b) and side view (c), and (b) shows the equilibrium configuration of the cell membrane from the side view. The blue sphere represents a lipid particle and the red sphere signifies an actin junctional complex. The gray sphere represents a spectrin particle and the black sphere represents a glycophorin particle. The yellow and green circles correspond to a band-3 complex connected to the spectrin network and a mobile band-3 complex, respectively. Reproduced from Li and Lykotrafitis (2014a), by permission

