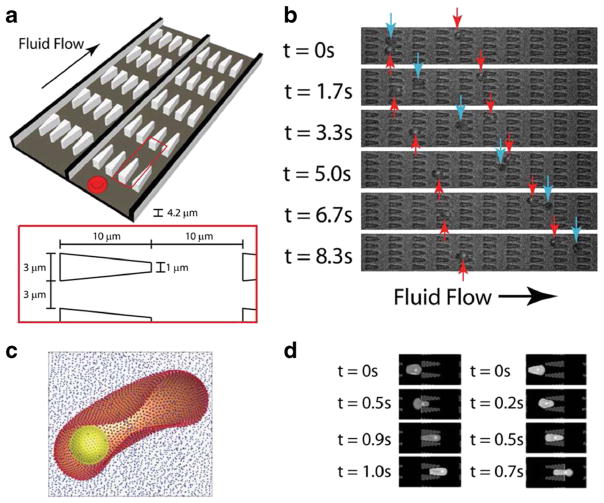
Fig. 6.
a Illustration of the flow cytometer device. b Experimental images of ring-stage infected (red arrows) and uninfected (blue arrows) RBCs in the channels. c The computational RBC model consists of 5000 particles connected with links. The parasite is modeled as a rigid sphere inside the cell. d DPD simulation images of malaria-infected RBCs traveling in channels of converging (left) and diverging (right) pore geometries. Reproduced from Bow et al. (2011), by permission

