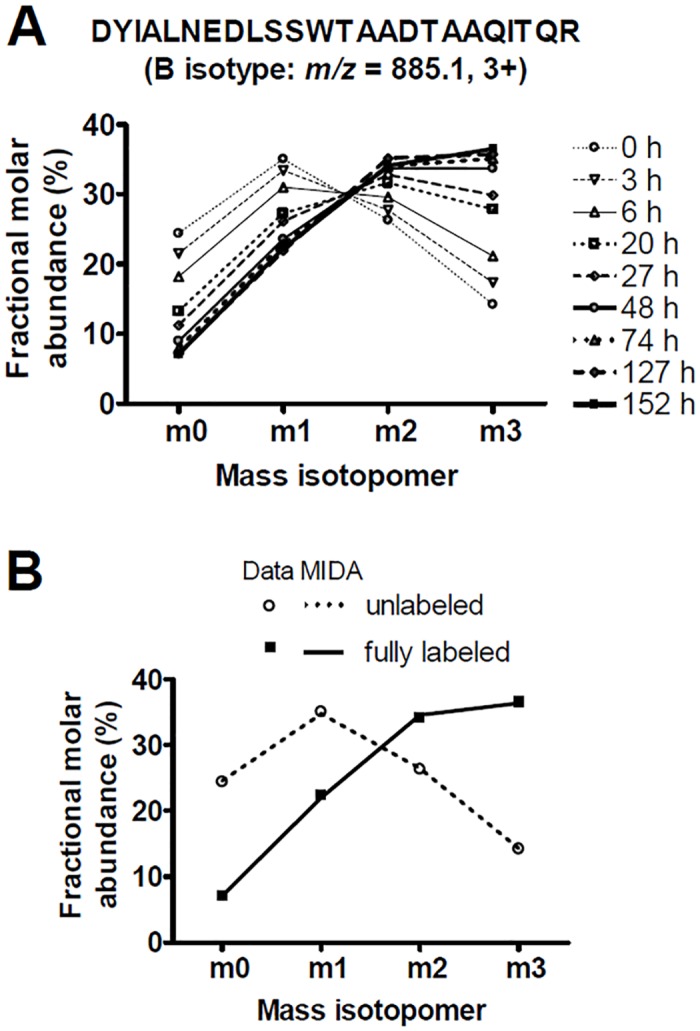
Fig 2. Effect of 2H2O labeling on peptide mass isotopomer distributions.

(A) Mass isotopomer distributions of a MHCI-derived, B isotype-specific tryptic peptide from KG-1 cells after labeling with 2H2O for various times. Lines connect data at each time point. Within error, each mass isotopomer changed from its initial (unlabeled) to final plateau (fully-labeled) value at the same rate, which is identical to the rate of protein fractional synthesis. (B) For the same peptide, MIDA models for the unlabeled and fully-labeled mass isotopomer distributions (dashed and solid lines, respectively) were compared with experimental data (symbols). RMSD values were 0.20% and 0.25%, respectively, for unlabeled and fully-labeled samples).
