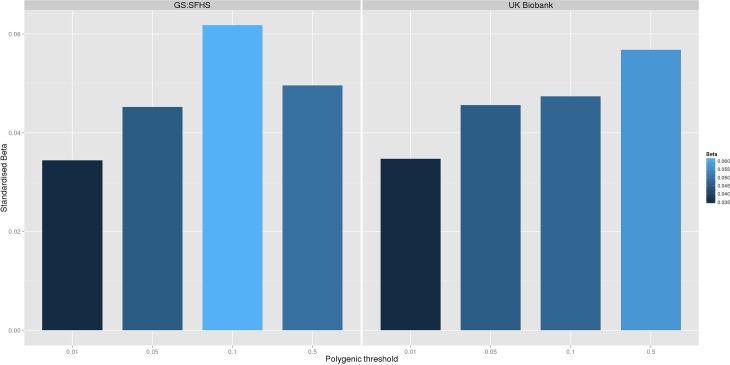
Fig 1.
The association between Pfizer-23andMe–derived polygenic risk profiles scores for pain on chronic pain phenotypes in GS:SFHS (left panel) and UK Biobank (right panel). This figure shows the association between polygenic risk scores for pain (derived from Pfizer-23andMe data) and chronic pain in GS:SFHS (left panel) and UK Biobank (right panel). Vertical y-axis represents the effect size as a standardised beta; horizontal axis represents the four alternative p-value thresholds used for the generation of polygenic scores in the discovery GWAS studies.

