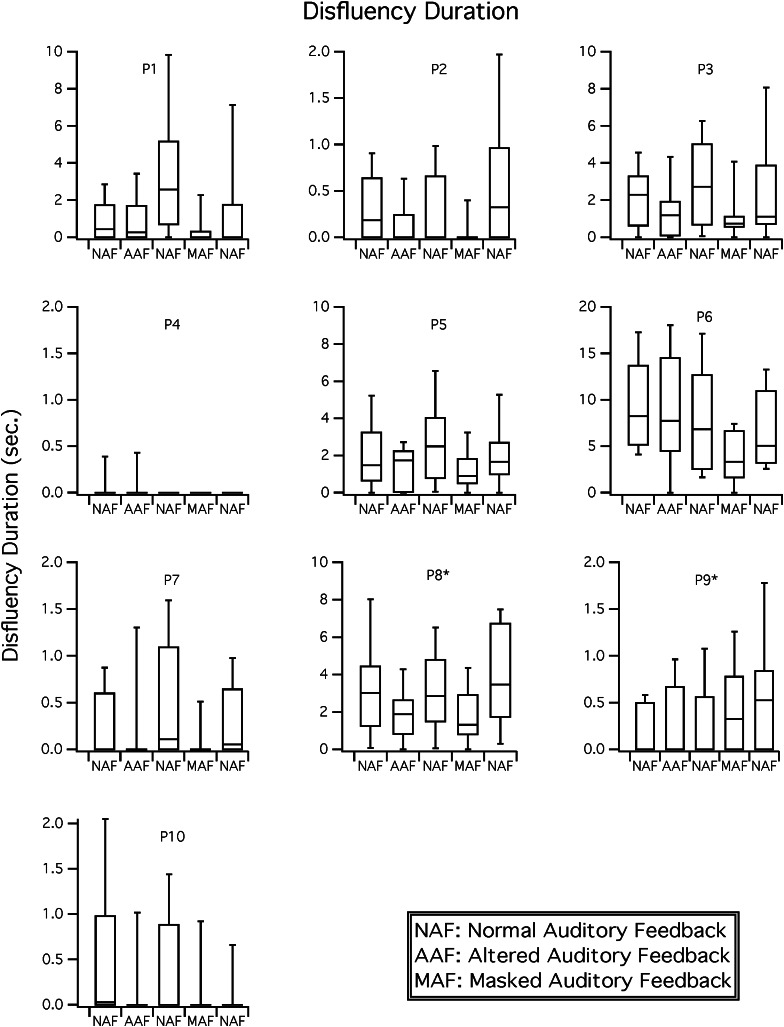
Figure 2.
Disfluency duration results. Boxplots for disfluency duration (in seconds) are shown for each participant in NAF, delayed and frequency shifted feedback (i.e., AAF), and MAF conditions. Participants 8 and 9 received the conditions with MAF in the second position and AAF in the fourth position; these conditions were presented in the reverse order for all other participants.

