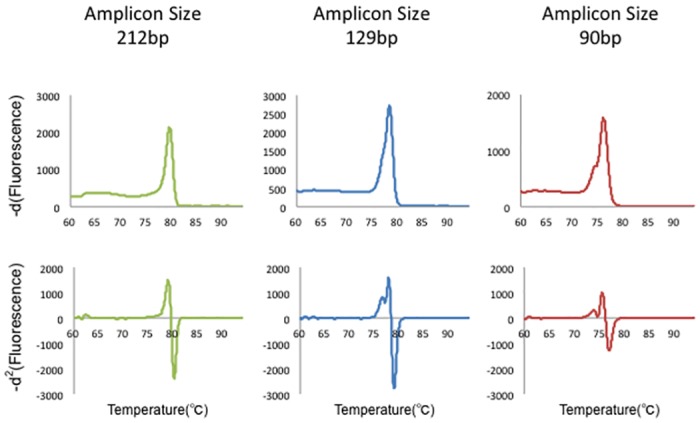
Fig 1. HRM analysis using different amplicon lengths.

Multiple amplicon lengths (90, 129, and 212 bp) were tested for mutation analyses in order to optimize the HRM analysis. First row: -d1 curve; second row: -d2 curve. The 90-bp amplicon showed the most interpretable heteroduplex-derived peaks.
