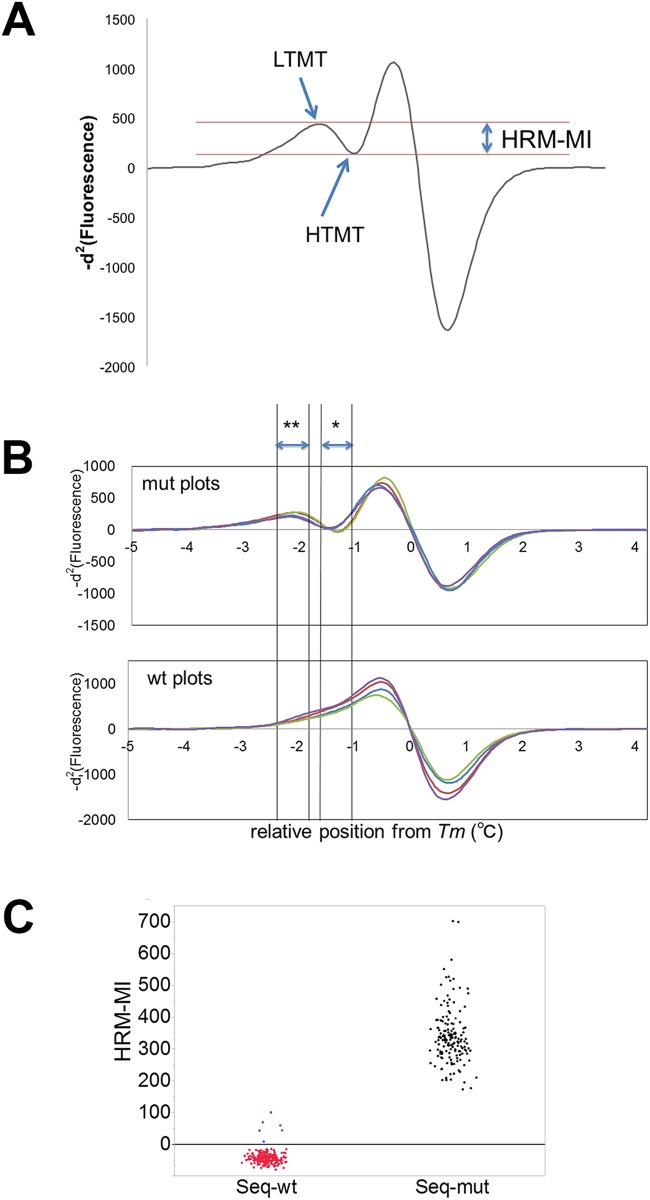
Fig 5. HRM-MI assay.
A) Representation of the HRM-Mutation Index (HRM-MI), which is defined as the difference between the low-temperature melting transition and high-temperature melting transition. B) Representative -d2 curves of mutated and wild-type DNA samples. The x-axis indicates the position relative to Tm. A single asterisk shows ZHTMT, and double asterisk shows ZLTMT. Mutated DNA samples presented positive values of HRM-MIs owing to heteroduplex-derived peaks (upper graph). Conversely, wild-type DNA samples showed simple ascending curves between ZHTMT and ZLTMT, and negative HRM-MI values (lower graph). The colors represent different samples. C) Distribution plots of HRM-MI for 192 DNA samples analyzed for IDH1R132. All-HRM-MI values of sequence-mutant (seq-mut) DNA samples were distributed in the positive range (black plots). The corresponding values for all wild-type (seq-wt) DNA samples were negatively dispersed (red plots), except for six values (blue plots) obtained from the duplicated results of three DNA samples.

