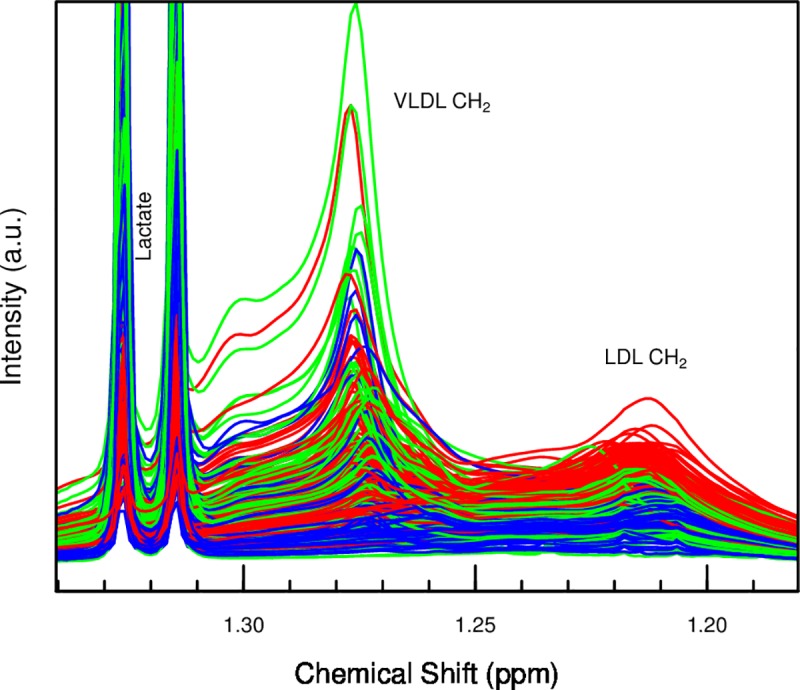
Fig 3. Lipid region of plasma spectra.

Color-coded red, green, blue for time points t1, t2, t3, before subtraction of baseline. Note the clear decrease in the LDL associated signal.

Color-coded red, green, blue for time points t1, t2, t3, before subtraction of baseline. Note the clear decrease in the LDL associated signal.