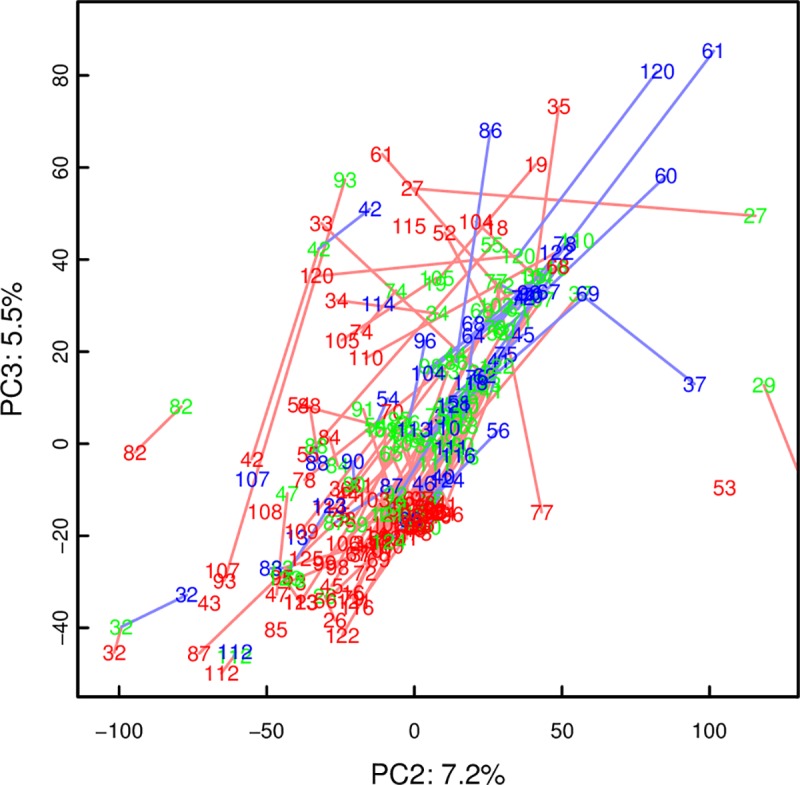
Fig 4. PCA scores plot of urine spectra.

UV-scaled, same color-code as plasma PCA above. Showing components 2 and 3 where the separation between the time points was more apparent.

UV-scaled, same color-code as plasma PCA above. Showing components 2 and 3 where the separation between the time points was more apparent.