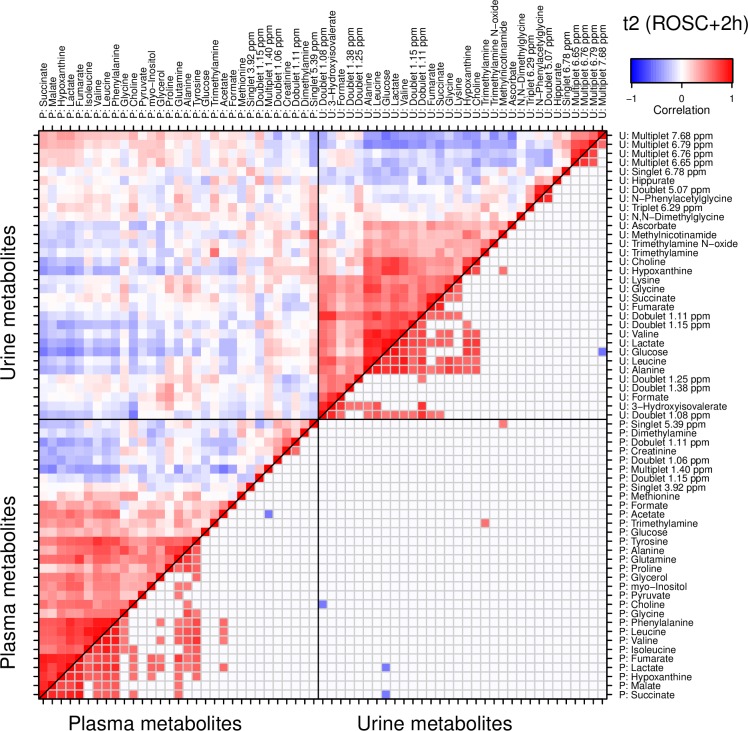
Fig 6. Correlations between plasma and creatinine-normalized urine metabolite concentrations at time point t2.
2 hours after return of spontaneous circulation (ROSC). The plasma (lower left) and urine (upper right) submatrices are ordered by independent hierarchical clustering (HCA). The lower right half of the entire matrix (i.e. below the diagonal) is truncated to only show strong correlations with |r|>0.5. Note again that while there are groups of correlated metabolites within the plasma and urine subsets, the correlation between the materials is comparably weak.

