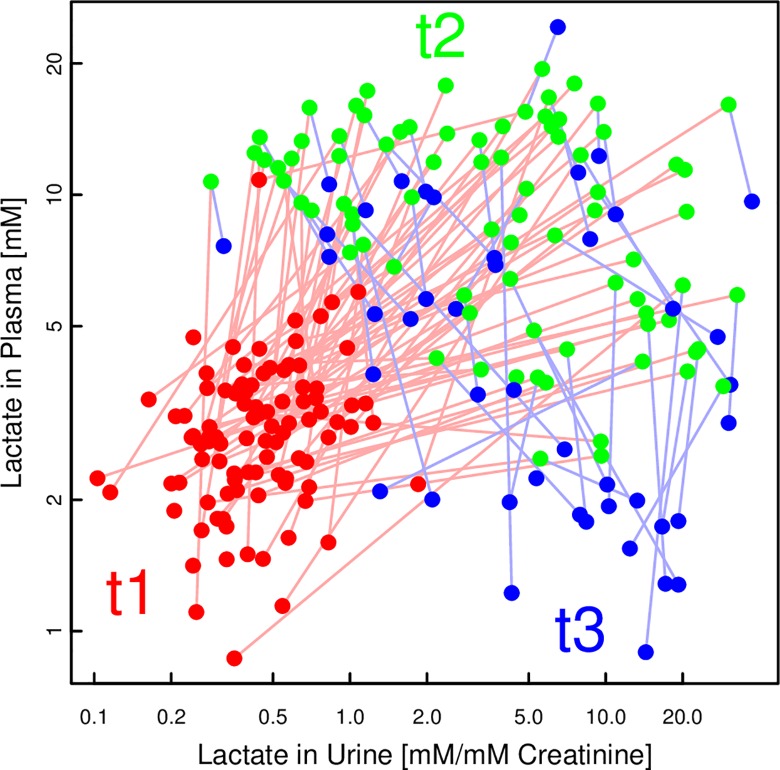
Fig 7. Scatter plot of lactate concentrations of individual pigs at all time points, in plasma and urine.
While both plasma and urine lactate concentrations have increased between t1 (before asphyxiation; red) and t2 (2h after ROSC; green), the subsequent decrease in plasma at t3 (4h after ROSC; blue) is not yet reflected in urine.

