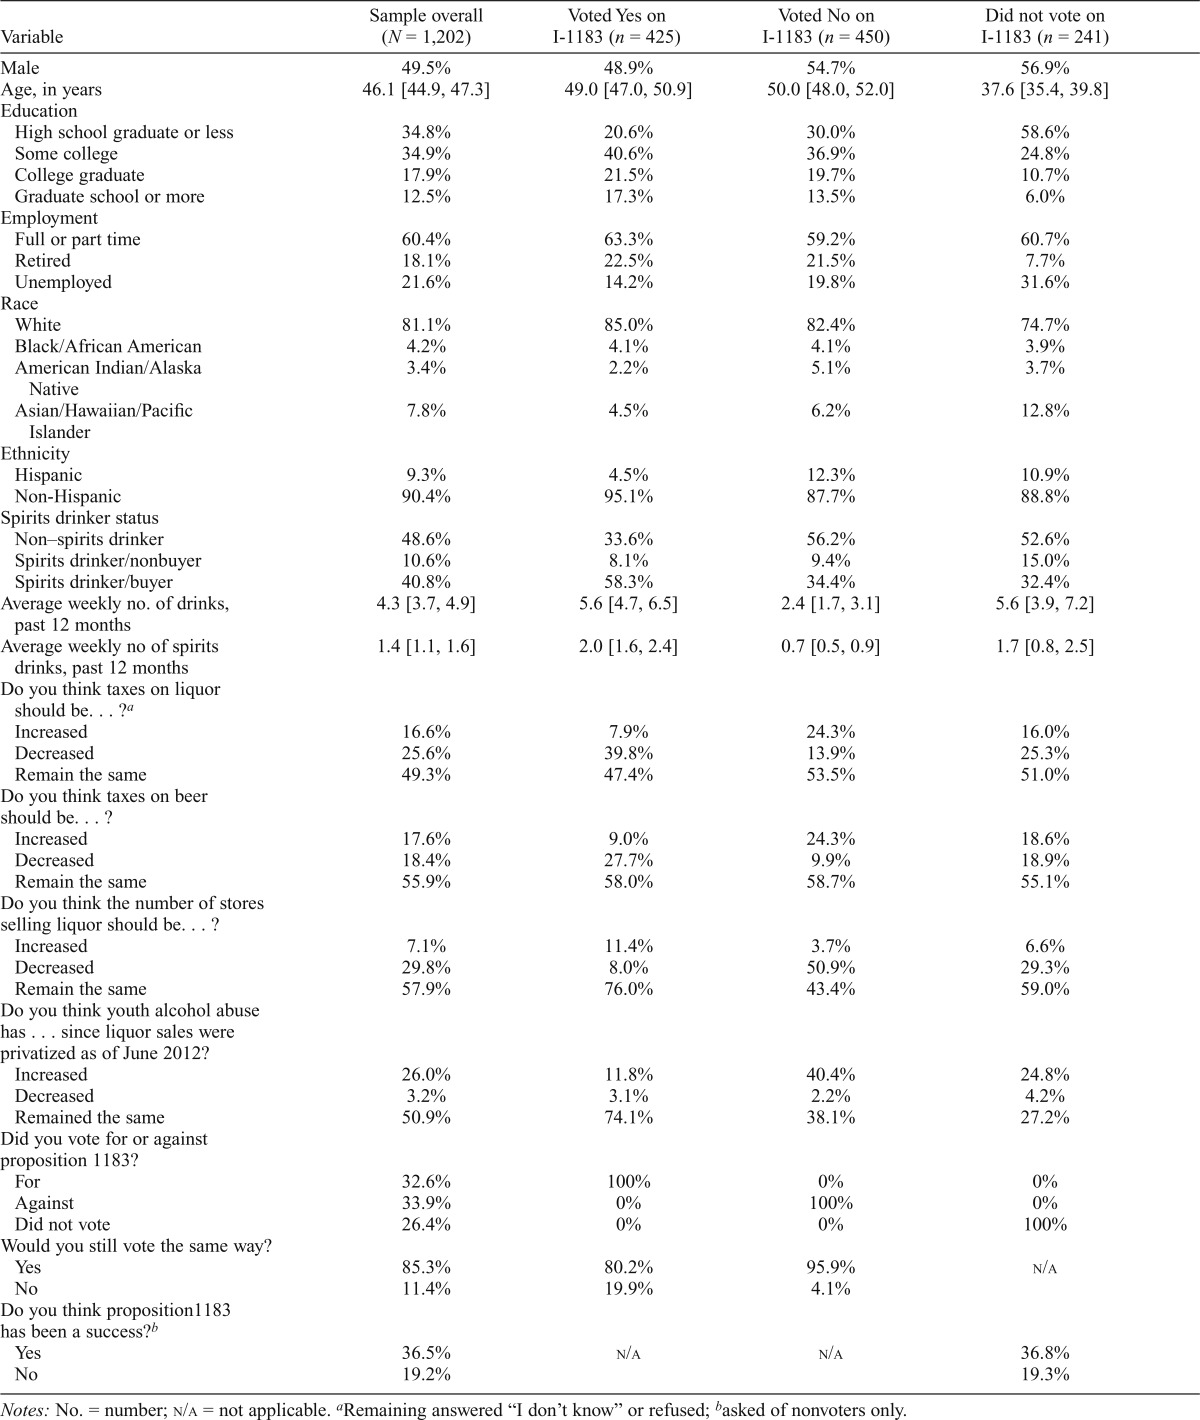
Table 1.
Demographics and policy opinions for Washington State residents (percentages; means and 95% confidence intervals)
| Variable | Sample overall (N = 1,202) | Voted Yes on I-1183 (n = 425) | Voted No on I-1183 (n = 450) | Did not vote on I-1183 (n = 241) |
| Male | 49.5% | 48.9% | 54.7% | 56.9% |
| Age, in years | 46.1 [44.9, 47.3] | 49.0 [47.0, 50.9] | 50.0 [48.0, 52.0] | 37.6 [35.4, 39.8] |
| Education | ||||
| High school graduate or less | 34.8% | 20.6% | 30.0% | 58.6% |
| Some college | 34.9% | 40.6% | 36.9% | 24.8% |
| College graduate | 17.9% | 21.5% | 19.7% | 10.7% |
| Graduate school or more | 12.5% | 17.3% | 13.5% | 6.0% |
| Employment | ||||
| Full or part time | 60.4% | 63.3% | 59.2% | 60.7% |
| Retired | 18.1% | 22.5% | 21.5% | 7.7% |
| Unemployed | 21.6% | 14.2% | 19.8% | 31.6% |
| Race | ||||
| White | 81.1% | 85.0% | 82.4% | 74.7% |
| Black/African American | 4.2% | 4.1% | 4.1% | 3.9% |
| American Indian/Alaska Native | 3.4% | 2.2% | 5.1% | 3.7% |
| Asian/Hawaiian/Pacific Islander | 7.8% | 4.5% | 6.2% | 12.8% |
| Ethnicity | ||||
| Hispanic | 9.3% | 4.5% | 12.3% | 10.9% |
| Non-Hispanic | 90.4% | 95.1% | 87.7% | 88.8% |
| Spirits drinker status | ||||
| Non-spirits drinker | 48.6% | 33.6% | 56.2% | 52.6% |
| Spirits drinker/nonbuyer | 10.6% | 8.1% | 9.4% | 15.0% |
| Spirits drinker/buyer | 40.8% | 58.3% | 34.4% | 32.4% |
| Average weekly no. of drinks, past 12 months | 4.3 [3.7, 4.9] | 5.6 [4.7, 6.5] | 2.4 [1.7, 3.1] | 5.6 [3.9, 7.2] |
| Average weekly no of spirits drinks, past 12 months | 1.4 [1.1, 1.6] | 2.0 [1.6, 2.4] | 0.7 [0.5, 0.9] | 1.7 [0.8, 2.5] |
| Do you think taxes on liquor should be… ?a | ||||
| Increased | 16.6% | 7.9% | 24.3% | 16.0% |
| Decreased | 25.6% | 39.8% | 13.9% | 25.3% |
| Remain the same | 49.3% | 47.4% | 53.5% | 51.0% |
| Do you think taxes on beer should be… ? | ||||
| Increased | 17.6% | 9.0% | 24.3% | 18.6% |
| Decreased | 18.4% | 27.7% | 9.9% | 18.9% |
| Remain the same | 55.9% | 58.0% | 58.7% | 55.1% |
| Do you think the number of stores selling liquor should be… ? | ||||
| Increased | 7.1% | 11.4% | 3.7% | 6.6% |
| Decreased | 29.8% | 8.0% | 50.9% | 29.3% |
| Remain the same | 57.9% | 76.0% | 43.4% | 59.0% |
| Do you think youth alcohol abuse has … since liquor sales were privatized as of June 2012? | ||||
| Increased | 26.0% | 11.8% | 40.4% | 24.8% |
| Decreased | 3.2% | 3.1% | 2.2% | 4.2% |
| Remained the same | 50.9% | 74.1% | 38.1% | 27.2% |
| Did you vote for or against proposition 1183? | ||||
| For | 32.6% | 100% | 0% | 0% |
| Against | 33.9% | 0% | 100% | 0% |
| Did not vote | 26.4% | 0% | 0% | 100% |
| Would you still vote the same way? | ||||
| Yes | 85.3% | 80.2% | 95.9% | n/a |
| No | 11.4% | 19.9% | 4.1% | |
| Do you think proposition1183 has been a success?b | ||||
| Yes | 36.5% | n/a | n/a | 36.8% |
| No | 19.2% | 19.3% | ||
Notes: No. = number; n/a = not applicable.
Remaining answered “I don’t know” or refused;
asked of nonvoters only.

