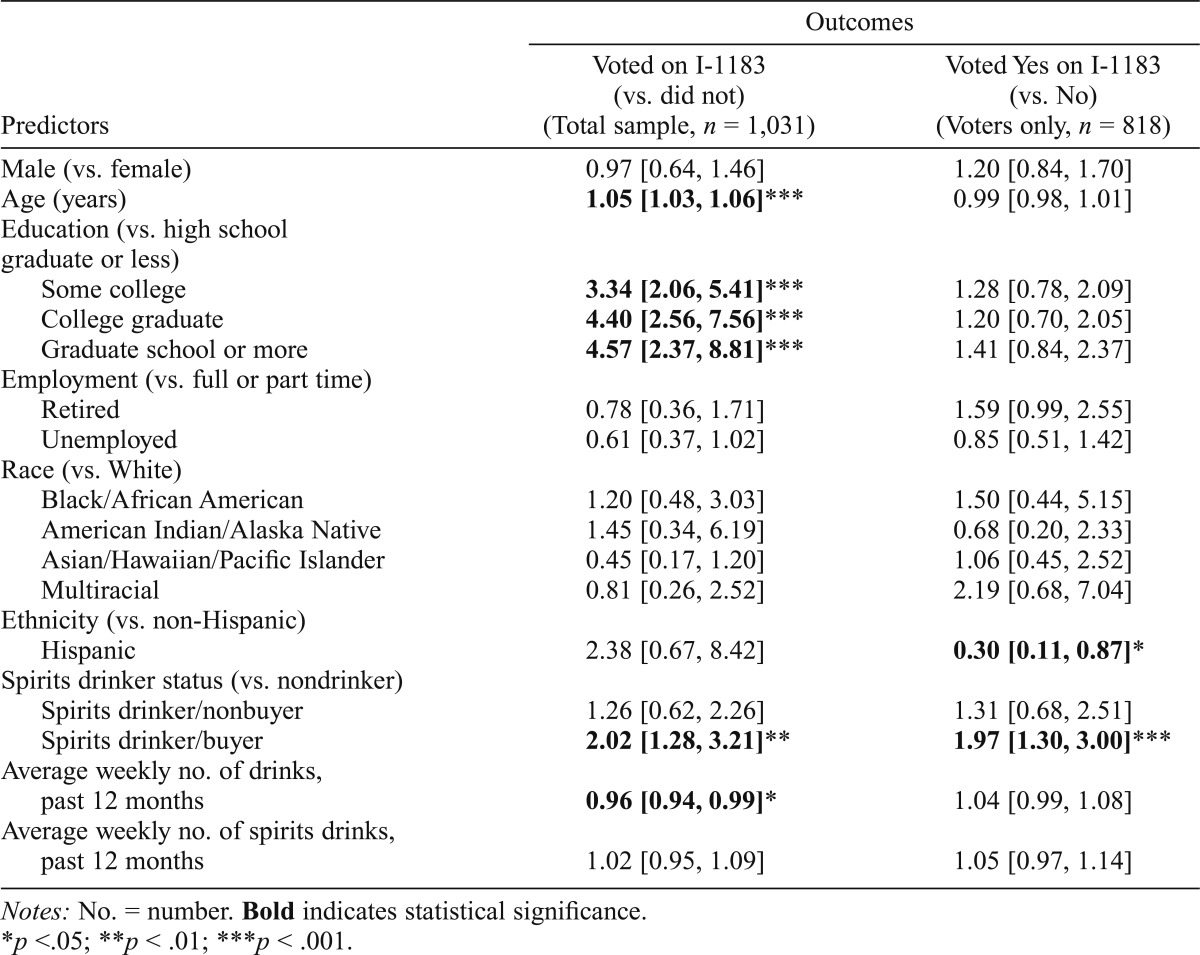
Table 2.
Adjusted odds ratios with 95% confidence intervals from weighted regressions of demographics and drinking variables regressed on Initiative 1183 voting-related outcomes
| Outcomes |
||
| Predictors | Voted on I-1183 (vs. did not) (Total sample, n = 1,031) | Voted Yes on I-1183 (vs. No) (Voters only, n = 818) |
| Male (vs. female) | 0.97 [0.64, 1.46] | 1.20 [0.84, 1.70] |
| Age (years) | 1.05 [1.03, 1.06]*** | 0.99 [0.98, 1.01] |
| Education (vs. high school graduate or less) | ||
| Some college | 3.34 [2.06, 5.41]*** | 1.28 [0.78, 2.09] |
| College graduate | 4.40 [2.56, 7.56]*** | 1.20 [0.70, 2.05] |
| Graduate school or more | 4.57 [2.37, 8.81]*** | 1.41 [0.84, 2.37] |
| Employment (vs. full or part time) | ||
| Retired | 0.78 [0.36, 1.71] | 1.59 [0.99, 2.55] |
| Unemployed | 0.61 [0.37, 1.02] | 0.85 [0.51, 1.42] |
| Race (vs. White) | ||
| Black/African American | 1.20 [0.48, 3.03] | 1.50 [0.44, 5.15] |
| American Indian/Alaska Native | 1.45 [0.34, 6.19] | 0.68 [0.20, 2.33] |
| Asian/Hawaiian/Pacific Islander | 0.45 [0.17, 1.20] | 1.06 [0.45, 2.52] |
| Multiracial | 0.81 [0.26, 2.52] | 2.19 [0.68, 7.04] |
| Ethnicity (vs. non-Hispanic) | ||
| Hispanic | 2.38 [0.67, 8.42] | 0.30 [0.11, 0.87]* |
| Spirits drinker status (vs. nondrinker) | ||
| Spirits drinker/nonbuyer | 1.26 [0.62, 2.26] | 1.31 [0.68, 2.51] |
| Spirits drinker/buyer | 2.02 [1.28, 3.21]** | 1.97 [1.30, 3.00]*** |
| Average weekly no. of drinks, past 12 months | 0.96 [0.94, 0.99]* | 1.04 [0.99, 1.08] |
| Average weekly no. of spirits drinks, past 12 months | 1.02 [0.95, 1.09] | 1.05 [0.97, 1.14] |
Notes: No. = number. Bold indicates statistical significance.
p <.05;
p < .01;
p < .001.

