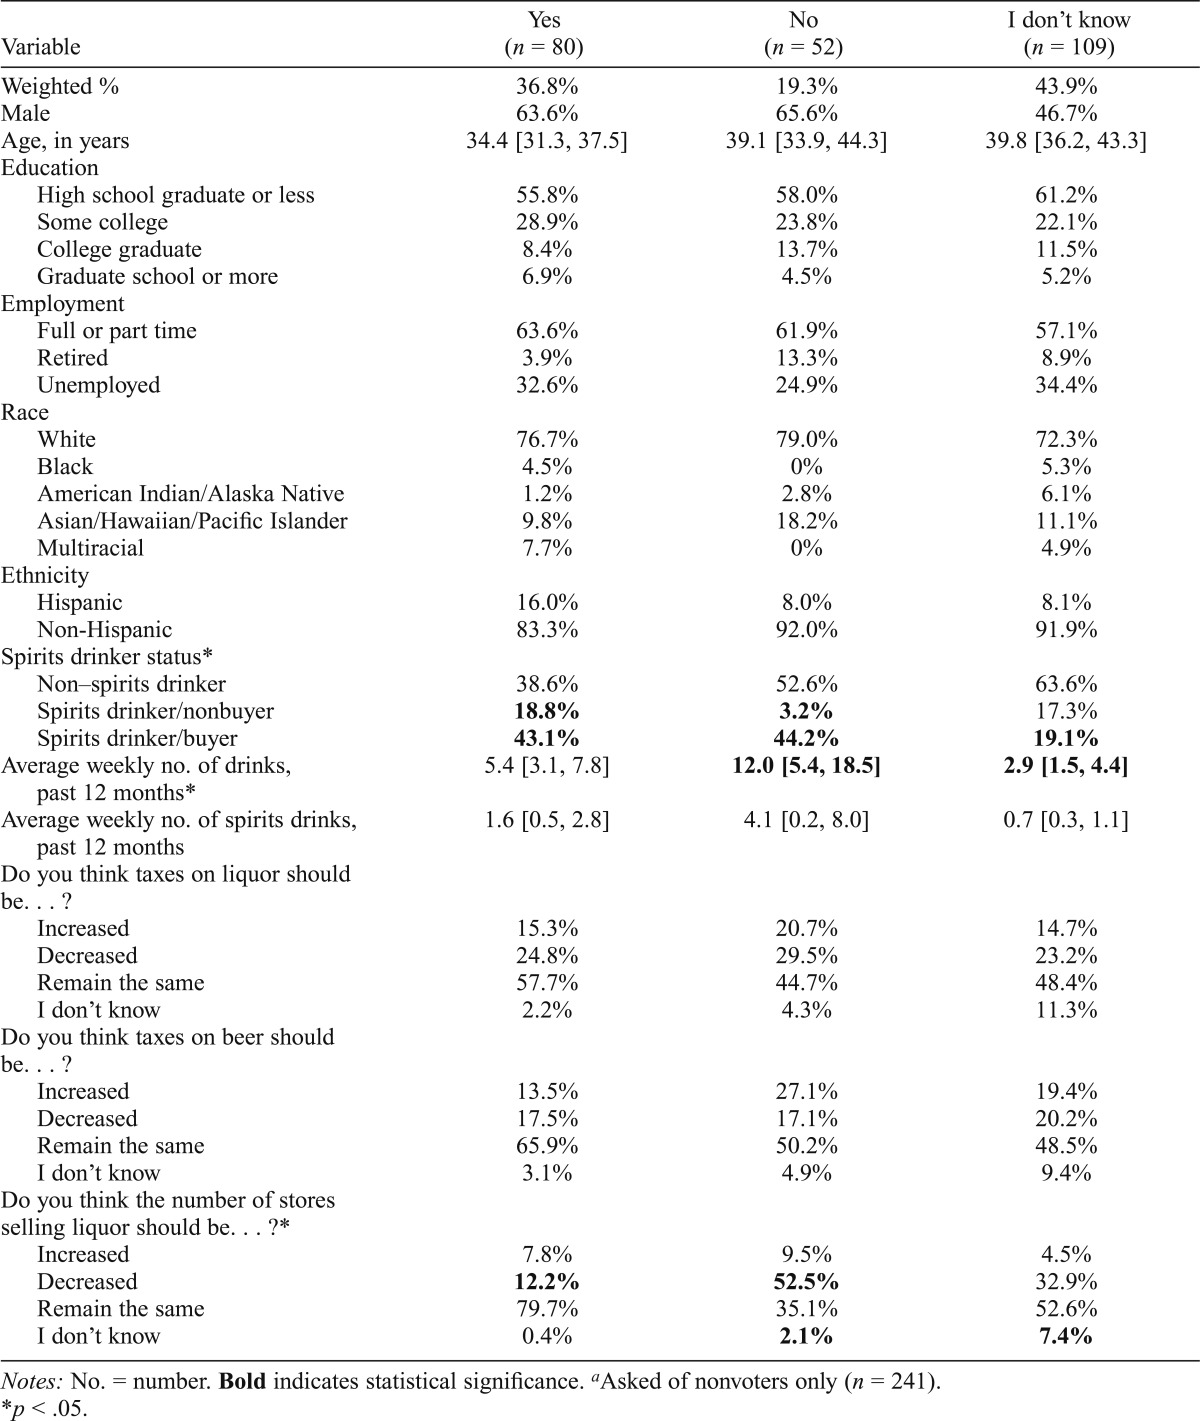
Table 4.
Demographics and policy opinions for those who answered “Yes” vs. “No” vs. “I don’t know” to the question, “Do you think that proposition 1183, privatizing liquor sales, has been a success?”a (percentages or means [95% confidence intervals])
| Variable | Yes (n = 80) | No (n = 52) | I don’t know (n = 109) |
| Weighted % | 36.8% | 19.3% | 43.9% |
| Male | 63.6% | 65.6% | 46.7% |
| Age, in years | 34.4 [31.3, 37.5] | 39.1 [33.9, 44.3] | 39.8 [36.2, 43.3] |
| Education | |||
| High school graduate or less | 55.8% | 58.0% | 61.2% |
| Some college | 28.9% | 23.8% | 22.1% |
| College graduate | 8.4% | 13.7% | 11.5% |
| Graduate school or more | 6.9% | 4.5% | 5.2% |
| Employment | |||
| Full or part time | 63.6% | 61.9% | 57.1% |
| Retired | 3.9% | 13.3% | 8.9% |
| Unemployed | 32.6% | 24.9% | 34.4% |
| Race | |||
| White | 76.7% | 79.0% | 72.3% |
| Black | 4.5% | 0% | 5.3% |
| American Indian/Alaska Native | 1.2% | 2.8% | 6.1% |
| Asian/Hawaiian/Pacific Islander | 9.8% | 18.2% | 11.1% |
| Multiracial | 7.7% | 0% | 4.9% |
| Ethnicity | |||
| Hispanic | 16.0% | 8.0% | 8.1% |
| Non-Hispanic | 83.3% | 92.0% | 91.9% |
| Spirits drinker status* | |||
| Non-spirits drinker | 38.6% | 52.6% | 63.6% |
| Spirits drinker/nonbuyer | 18.8% | 3.2% | 17.3% |
| Spirits drinker/buyer | 43.1% | 44.2% | 19.1% |
| Average weekly no. of drinks, past 12 months* | 5.4 [3.1, 7.8] | 12.0 [5.4, 18.5] | 2.9 [1.5, 4.4] |
| Average weekly no. of spirits drinks, past 12 months | 1.6 [0.5, 2.8] | 4.1 [0.2, 8.0] | 0.7 [0.3, 1.1] |
| Do you think taxes on liquor should be… ? | |||
| Increased | 15.3% | 20.7% | 14.7% |
| Decreased | 24.8% | 29.5% | 23.2% |
| Remain the same | 57.7% | 44.7% | 48.4% |
| I don’t know | 2.2% | 4.3% | 11.3% |
| Do you think taxes on beer should be… ? | |||
| Increased | 13.5% | 27.1% | 19.4% |
| Decreased | 17.5% | 17.1% | 20.2% |
| Remain the same | 65.9% | 50.2% | 48.5% |
| I don’t know | 3.1% | 4.9% | 9.4% |
| Do you think the number of stores selling liquor should be… ?* | |||
| Increased | 7.8% | 9.5% | 4.5% |
| Decreased | 12.2% | 52.5% | 32.9% |
| Remain the same | 79.7% | 35.1% | 52.6% |
| I don’t know | 0.4% | 2.1% | 7.4% |
Notes: No. = number. Bold indicates statistical significance.
Asked of nonvoters only (n = 241).
p < .05.

