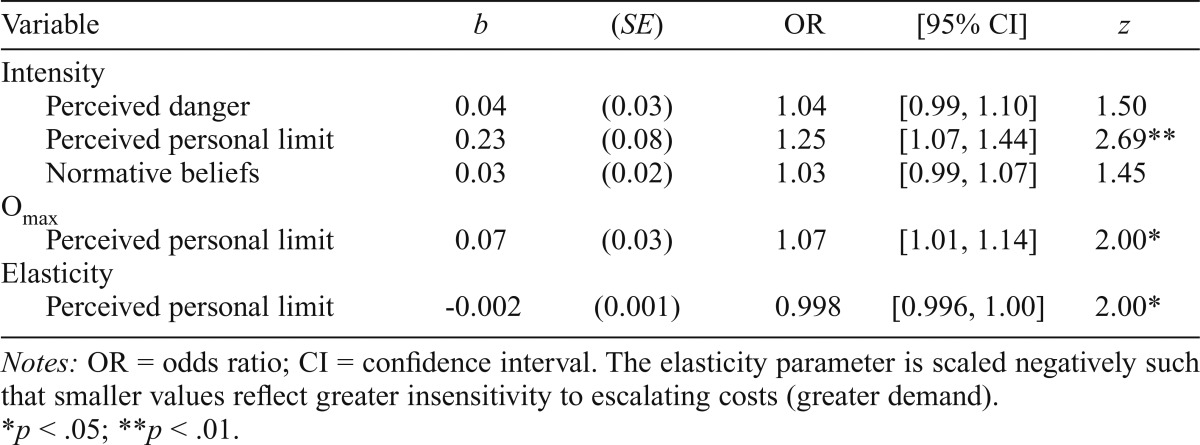
Table 1.
Indirect effect estimates for tests of mediation through drinking-and-driving cognitions
| Variable | b | (SE) | OR | [95% CI] | z |
| Intensity | |||||
| Perceived danger | 0.04 | (0.03) | 1.04 | [0.99, 1.10] | 1.50 |
| Perceived personal limit | 0.23 | (0.08) | 1.25 | [1.07, 1.44] | 2.69** |
| Normative beliefs | 0.03 | (0.02) | 1.03 | [0.99, 1.07] | 1.45 |
| Omax | |||||
| Perceived personal limit | 0.07 | (0.03) | 1.07 | [1.01, 1.14] | 2.00* |
| Elasticity | |||||
| Perceived personal limit | -0.002 | (0.001) | 0.998 | [0.996, 1.00] | 2.00* |
Notes: OR = odds ratio; CI = confidence interval. The elasticity parameter is scaled negatively such that smaller values reflect greater insensitivity to escalating costs (greater demand).
p < .05;
p < .01.

