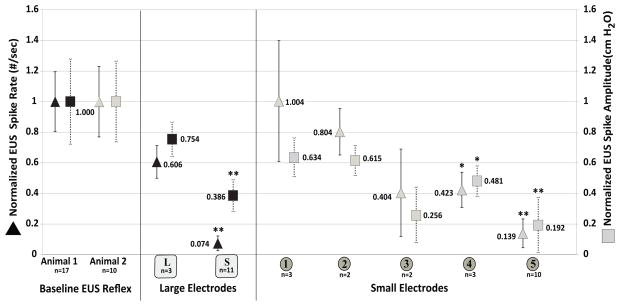
Figure 3. Spatial selectivity of stimulus location.
Sacral dermatome stimulation reduced urethral reflexes. Data from large lumbar [L] and sacral [S] electrode locations (Black symbols, animal 1) show sacral locations [S] reduce urethral reflexes. Finer resolution at location [S] using smaller electrodes [1–5] (gray symbols, animal 2) demonstrates further location specificity within the sacral dermatomes. Data are normalized to the baseline control evoked urethral activity Pur and Rur. EUS reflex spike rate (Rur) is shown on the left axis (■). EUS reflex spike amplitude is shown on the right axis (▲). Stimulus pattern shown for [L] and [S] is 20 Hz continuous; for [1–5] is [.75 ON .25 OFF, 20 Hz]. The number of trials (n) is shown for each location. *P<.05; ** P<.01.

