Figure 3.

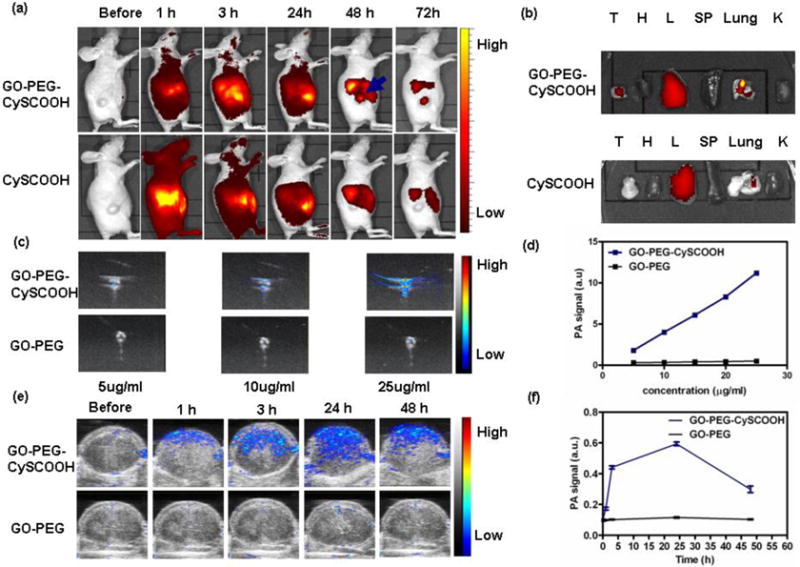
In vivo NIR fluorescence (FL) and photoacoustic (PA) imaging. (a) In vivo FL images of mice i.v. injected with CySCOOH and GO-PEG-CySCOOH at different time points post injection; (b) ex vivo NIR FL images of major tissues (T, tumor; H, heart; L, liver; SP, spleen; lung; K, kidneys), harvested from mice treated with free CySCOOH and GO-PEG-CySCOOH after 24 h treatment (c) Ex vive PA images of GO-PEG and GO-PEG-CySCOOH solution at different concentration (d) Ex vive Relative PA signal intensity of GO-PEG and GO-PEG-CySCOOH solution at different concentration (e) In vivo ultrasonic (US) and PA images of tumor of mice intravenously injected with GO-PEG and GO-PEG-CySCOOH at different time points. (f) Time course PA signal quantification change of tumors followed by intravenous injection of GO-PEG and GO-PEG-CySCOOH. (Error bars represent standard deviation; n = 3 per group)
