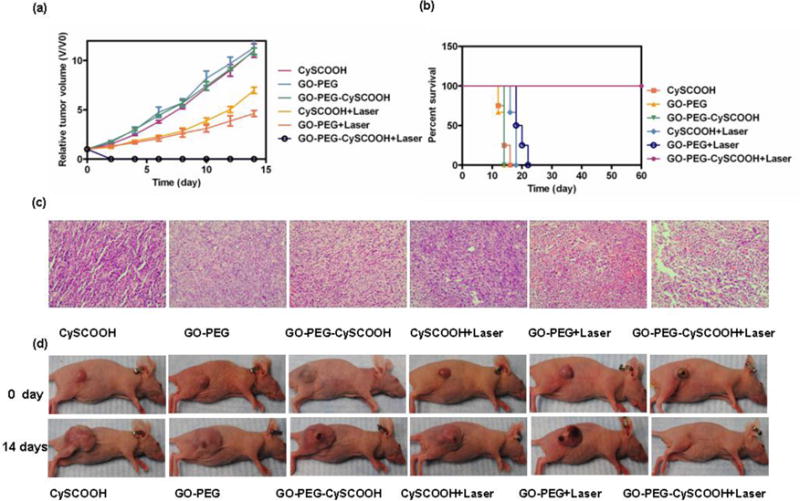
Figure 5.

In vivo photothermal therapy. (a) Tumor growth curves of different groups of 4T1 tumor-bearing mice after PTT. Tumor volumes were normalized to their initial sizes. (Error bars represent standard deviation; n = 6 per group P < 0.01). (b) Survival curves of tumor-bearing mice after various treatment (c) H&E staining of tumor sections obtained from different groups at 2 h after laser irradiation. (d) Representative photos of mice bearing 4T1 tumors at difference days after different treatments.
