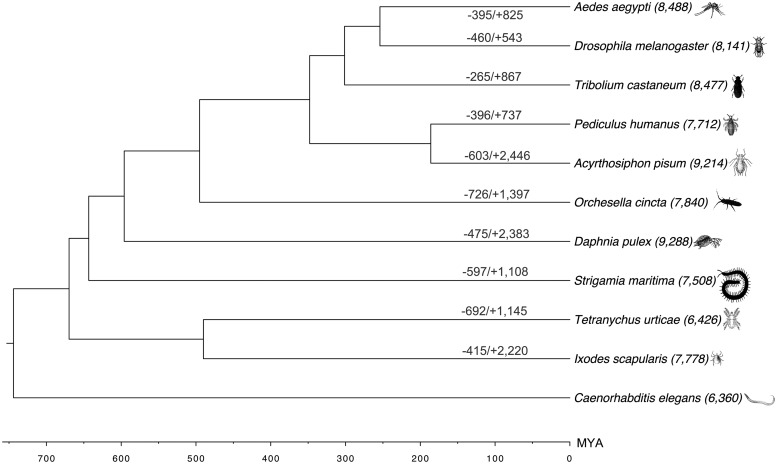
Fig. 2.—
Gene gain and loss analysis in O. cincta genome. The species tree was built by using species distances from TimeTree database (Hedges et al. 2006) Common Taxonomy Tree at NCBI. The divergence time between species is marked in million years. A total number of gene families, gene family gain (+) and loss (−) are indicated. The loss of a gene family is identified in species when a gene family exists in the neighboring branch and the out-group, but not in itself. The gene families in most recent common ancestor were defined as (1) those shared by two direct descendants and (2) shared by each of the direct descendants and the out-group (Cao et al. 2013).

