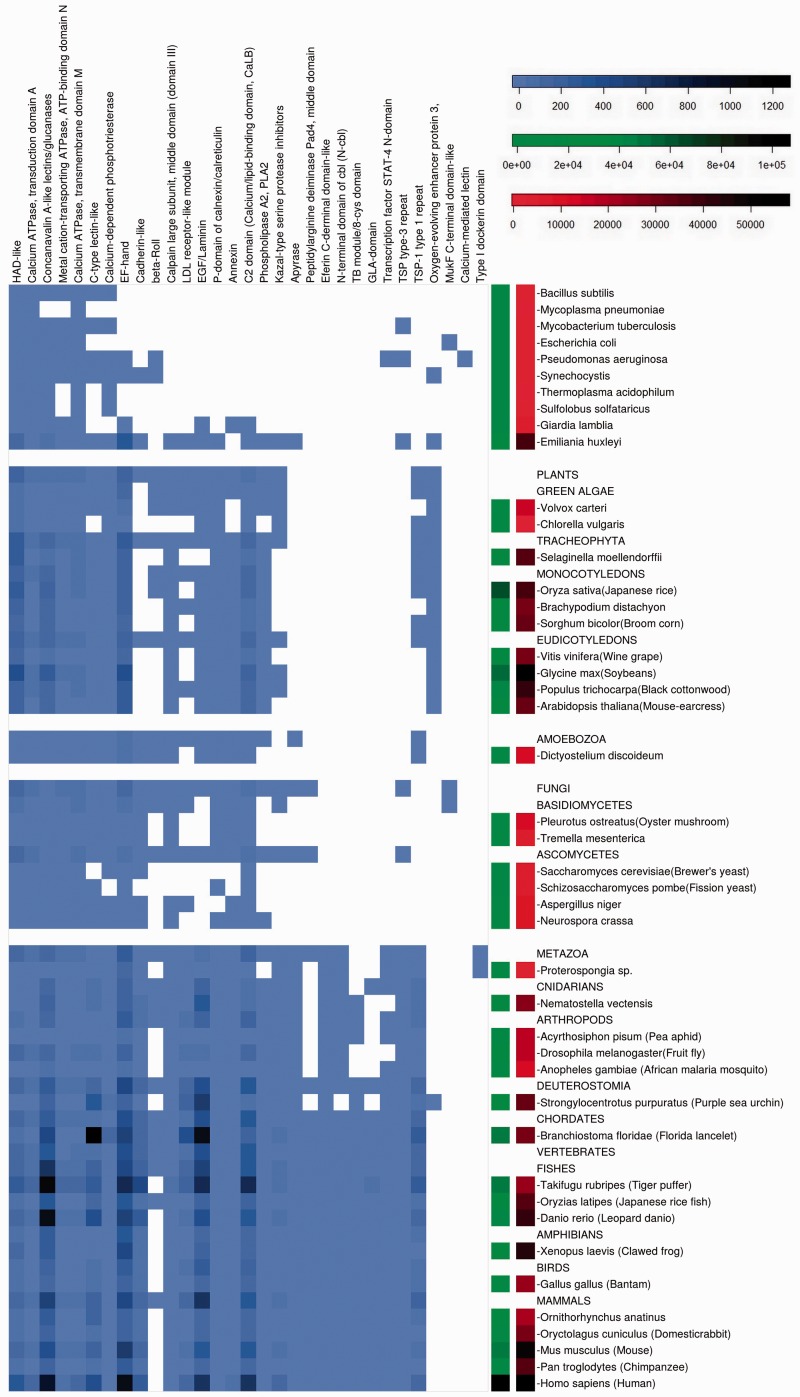
Fig. 2.
The occurences of building blocks of proteins (domains). Calcium-binding domains are labeled on the top horizontal axis. Both current and reconstructed ancestral organisms are labeled on the vertical axis. The entries of extint ancestral species represent their reconstructed proteome. The blue-scale of the matrix (on the left) stand for the number of proteins containing a calcium-binding domain that occur in each genome. The green-scale of the bar (middle) represents the diversity of proteins in the genome of each of the organisms (i.e., the size of the proteome). The red-scale of the bar (right side) represents the size of the genomes in number of genes. The scales of the color bar scale are indicated at the top right of the figure.

