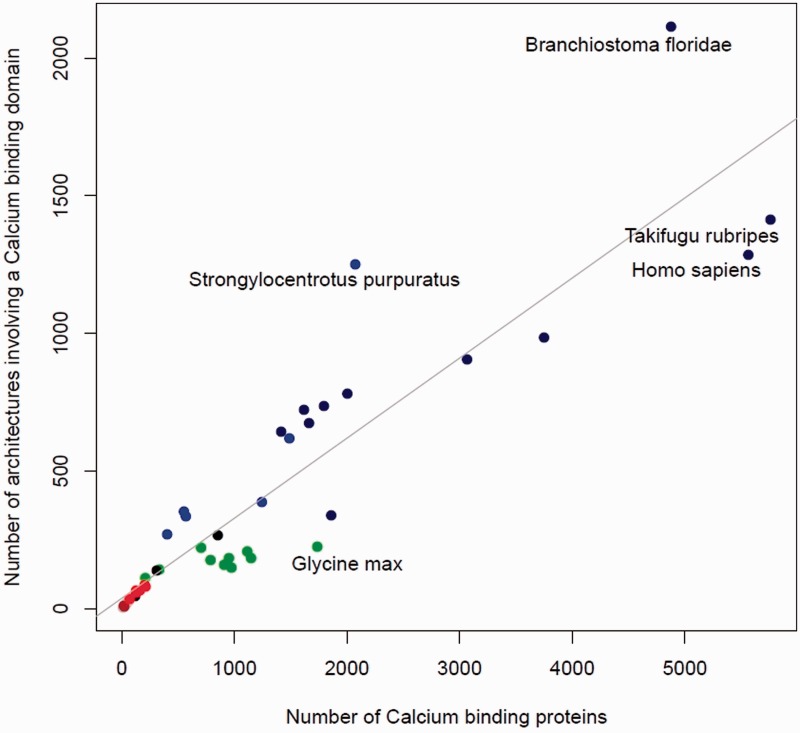
Fig. 3.
The number of domains correlating with the number of protein architectures. On the y axis is the number of different domain architectures containing at least one calcium-binding domain versus on the x axis the total number of proteins having these architectures. Each point on the graph represents a single proteome; the 44 proteomes used in figure 1 are plotted. Archaea are represented in brown, bacteria in gray, fungi in red, plants in green, chordates in dark blue, other metazoans in blue, and the rest of the eukaryotes in black. Shown in gray is a fitted regression line (Pearson correlation coefficient = 0.91).

