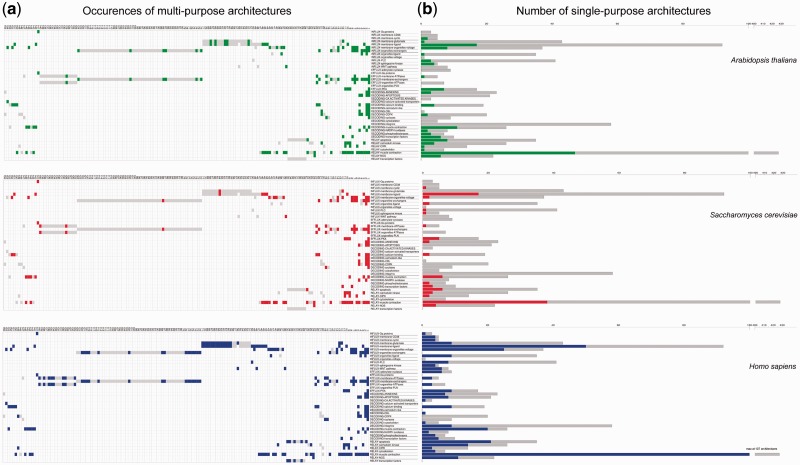
Fig. 6.
A functional breakdown of calcium-signaling architectures in three representative eukaryote genomes. The left part (a) shows multipurpose architectures and their functional components. Architectures present in the organism in question are displayed in colors, and totals for all organisms in gray. The right part (b) shows single-purpose architectures as histograms of the number (y axis) for each functional component (x axis). Data for the organism of interest are shown in colors, and totals for the 1,558 genomes are shown in gray.

