
Fig. 4.—
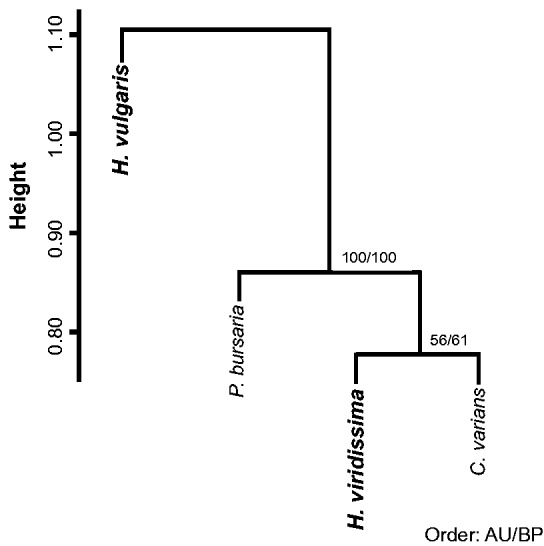
Dendrogram of endosymbiotic hosts based on the differential gene expression patterns. The analysis was conducted in the R package “pvclust” using the Ward’s method as the agglomerative method and Pearson correlations as the distance measure. Height represents dissimilarity between clusters that was calculated as 1 − (Pearson correlation coefficient). Numbers along branches indicate the approximately unbiased P value (AU) and the bootstrap probability (BP).