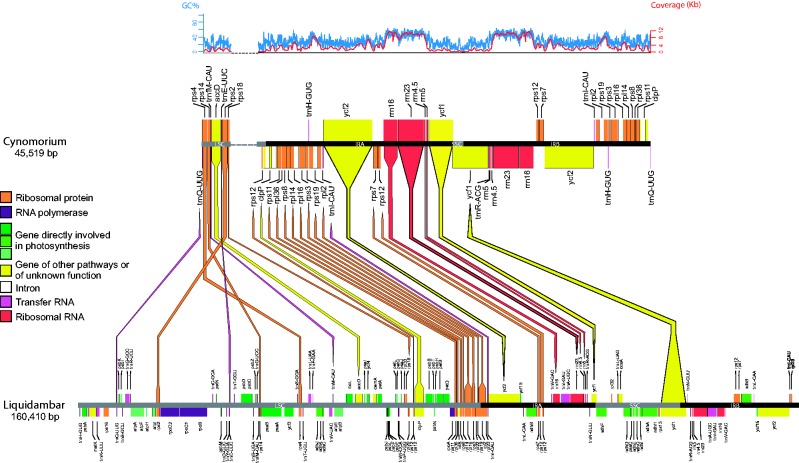
Fig. 2.—
Gene losses and rearrangements in the plastome of Cynomorium compared to that of Liquidambar formosana (GenBank accession KC588388). Colored lines link homologous genes between the two plastomes. The LSC of Cynomorium is divided in two parts (linked by the dotted line) to help visualization. Maps were drawn using OGDraw ( Lohse et al. 2013 ). GC content and coverage of the Cynomorium plastome are depicted in blue and red, respectively. (The pattern is the same when using less stringent mapping parameters; Results.).

