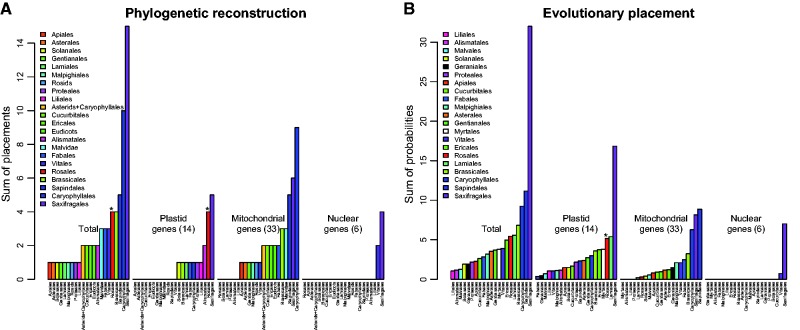
Fig. 4.—
Bar plots summarizing the analyses of single gene matrices when the rest of the topology was constrained to fit the currently accepted angiosperm relationships ( Angiosperm Phylogeny Group 2016 ). For simplicity, internally transferred gene copies were not included but their placements can be seen in supplementary figures S4–S6 , Supplementary Material online. (A) Results of ML tree searches. For each clade, the number of genes that placed Cynomorium sequence(s) in the respective clade is shown (details in supplementary figs. S4–S6 and table S4 , Supplementary Material online). (B) Results of evolutionary placement analyses (Materials and Methods). For each clade, the sum of the probabilities across all genes that placed Cynomorium in the respective clade is shown (details in supplementary fig. S7 , Supplementary Material online). For both analyses, results are shown overall and by genomic compartment. The asterisks indicate placements resulting exclusively from the sequences of Zhang et al. (2009) . Numbers of markers for each compartment are indicated in brackets.

