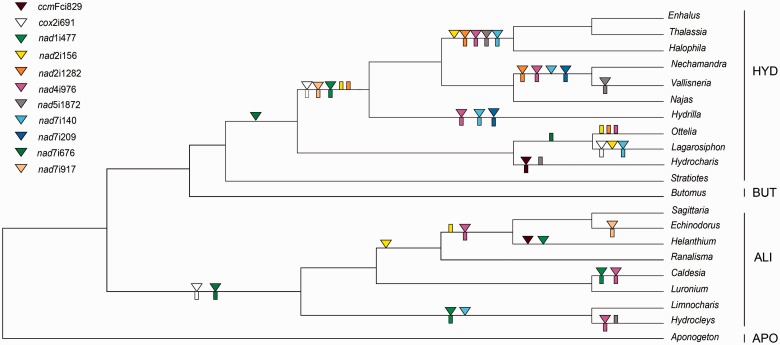
Fig. 2.—
Mapping of intron loss in Alismatales. Triangles represent an intron loss, and rectangles represent a loss >50% of edited sites in the adjacent exons to the intron indicated. Colors represent different introns, as specified in the figure. For simplicity, Alismatales families other than Aponogetonaceae (APO), Alismataceae (ALI), Butomaceae (BUT), and Hydrocharitaceae (HYD) are not shown in the tree.

