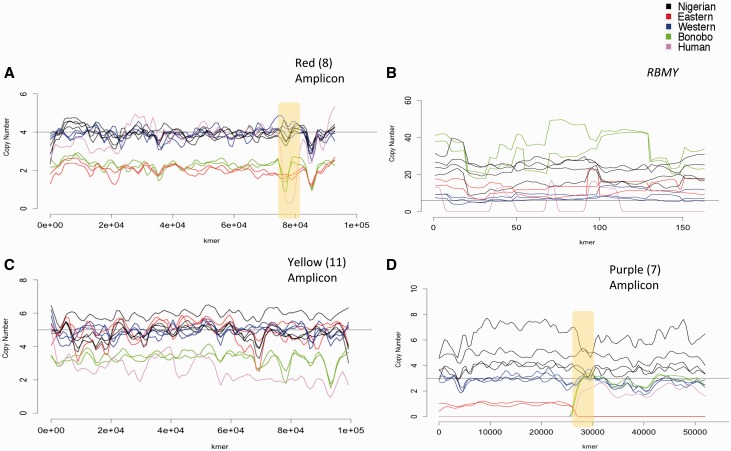
Fig. 2.—
Chimpanzee and bonobo amplicon copy number by k-mer. Amplicon copy numbers are plotted against k-mer position. Each line represents a single sample colored by species/subspecies and smoothed with lowess function. Copy number of the PanTro4 reference is drawn with a solid black line. Breakpoints of interest mentioned in the text are boxed in yellow. (A) Red amplicon, (B) RBMY, (C) yellow amplicon, and (D) purple amplicon.

