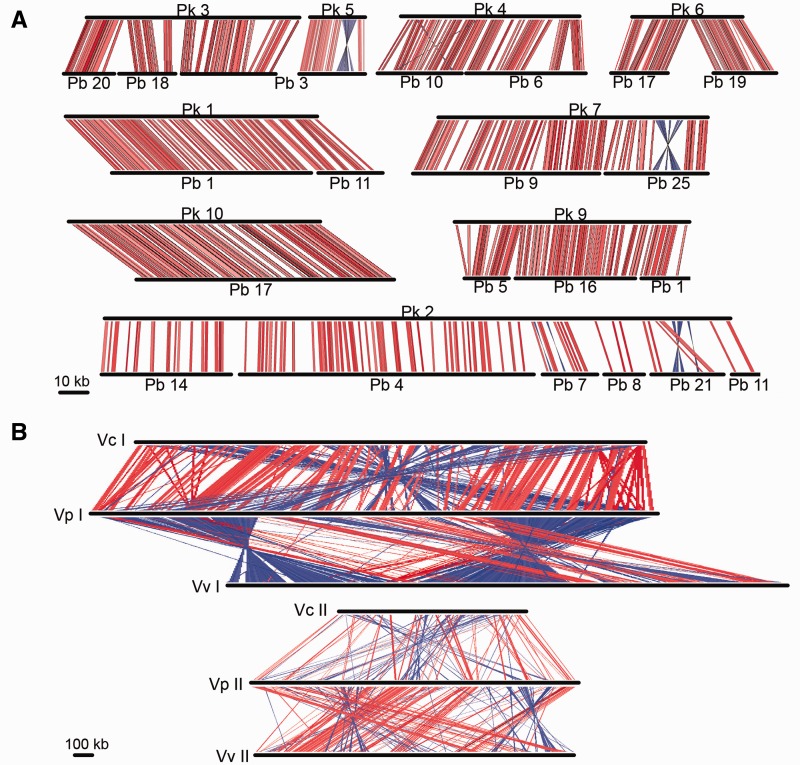
Fig. 1.—
Genome similarity between (A) the anomalopid symbionts, “Ca. Photodesmus katoptron” (Pk) and “Ca. Photodesmus blepharus” (Pb), and (B) free-living relatives V. cholerae N16961 (Vc), V. parahaemolyticus RIMD 2210633 (Vc), and V. vulnificus CMCP6 (Vv). Alignments were determined by the Artemis Comparison Tool (Carver et al. 2005). Each connecting line represents an area of high nucleotide sequence similarity; red lines indicate alignment of two positive strands and blue lines represent similarity between positive and negative strands. Homology was determined with an e value cutoff of 1.0. Chromosome segments in (A) are labeled by contig number and in (B) are labeled by chromosome number.

