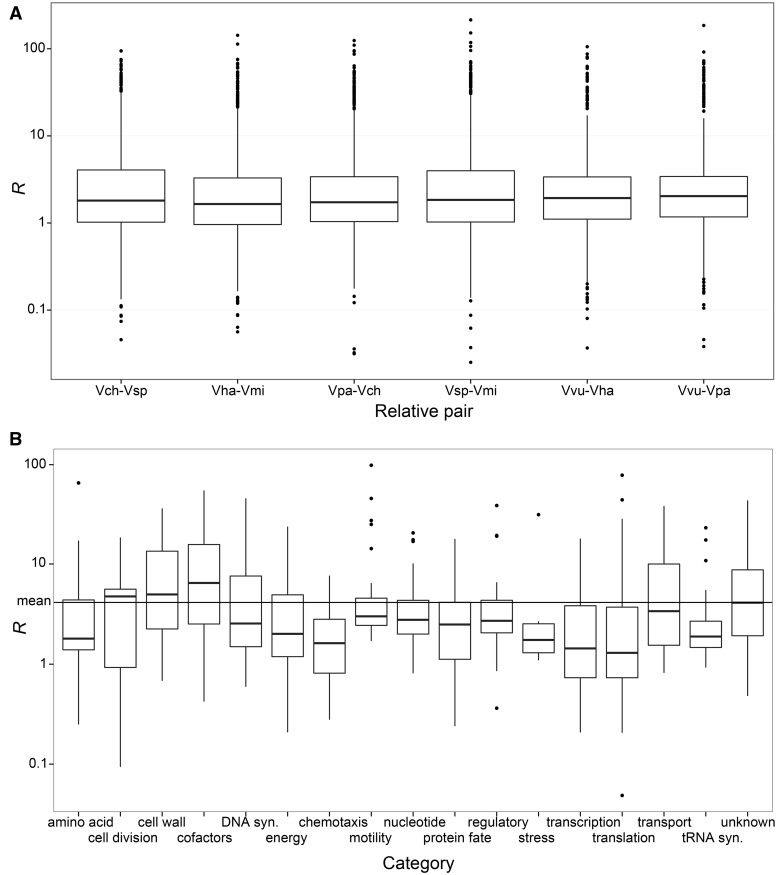
Fig. 2.—
Boxplots for R values indicating changes in purifying selection in anomalopid symbiont loci compared with orthologs in free-living relatives. (A) R values for each free-living relative comparison. (B) R values for each locus averaged across relative pair comparisons and divided into functional categories. The mean value of R across all loci is shown with a line and values < 1 indicate increased purifying selection.

