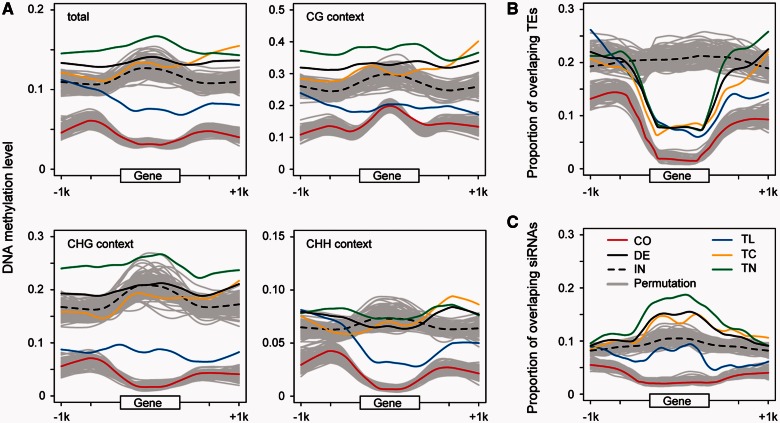
Fig. 3.—
DNA methylation levels and the proportion of overlapping TEs and siRNAs in genic and flanking regions. Genic regions were normalized to a length of 1 kb. The upper and lower grey curves in each panel are the resampling results for intergenic ORFs and 27,206 unigenes (782 loci resampled 100 times), respectively. (A) DNA methylation levels. Detailed statistics are listed in supplementary table S7, Supplementary Material online. (B) Proportions of overlapping TEs. (C) Proportions of overlapping siRNAs. CO, common genes; DE, de novo genes; IN, intergenic ORFs; TL, de novo genes with translational evidence; TC, de novo genes with only transcriptional evidence; TN, de novo genes without expression evidence.

