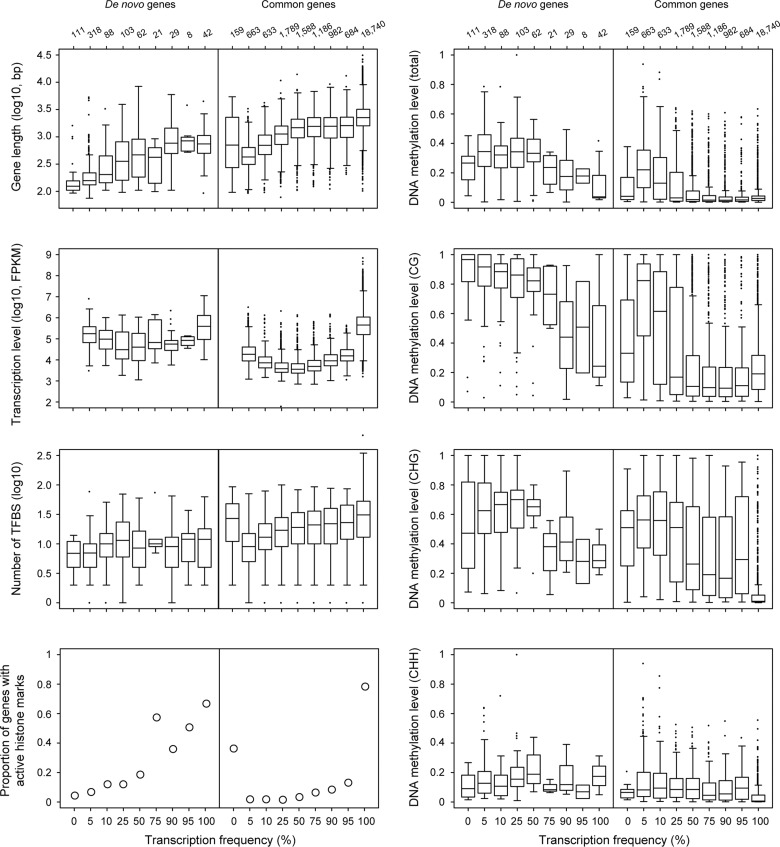
Fig. 4.—
Distribution of gene features with significant differences among de novo gene types with respect to Tfreq. Data 2 in supplementary table S3, Supplementary Material online were used in the comparison of transcription levels. DNA methylation levels were estimated in genic regions. Numbers above the top panel indicate the total numbers of genes used in the comparisons. CG, CHG, and CHH are DNA methylation in different contexts (H indicates A, C or T). Active histone markers are H3K4me3, H3K36me3, and H3K9Ac in Data 24 of supplementary table S3, Supplementary Material online.

