. 2016 Jul 21;5:e16135. doi: 10.7554/eLife.16135

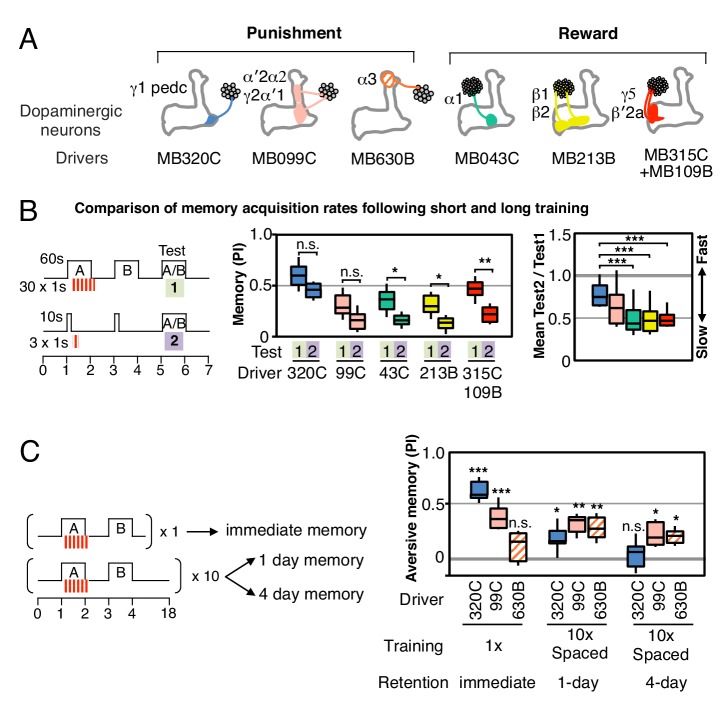
Figure 2. Rules for writing memory.

(A) Diagram of the DANs contained in split-GAL4 driver lines, which have been color-coded to facilitate comparison with the plots shown in the subsequent panels. Expression patterns of these drivers, including full confocal stacks, can be found at www.janelia.org/split-gal4. In all experiments, the drivers were crossed with 20xUAS-CsChrimson-mVenus in attP18. (B) Differential effect of training length among DANs. Left: Diagram of the experimental design. Immediate memories formed after paring a 60-s odor presentation with thirty 1-s CsChrimson-activating light pulses (Test 1) were compared with those obtained with a 10-s odor presentation paired with three 1-s light pulses (Test 2). Center: A 60-s training period resulted in significantly better memory performance compared with a 10-s training for MB043C, MB213B and MB315C+MB109B (data from ISI = 0 s for MB099C and ISI =+ 10 s for others drivers were used to provide maximum memory formation; see ISI curves in Figure 2—figure supplement 4). We also observed increased learning with 60-s versus 10-s training (PI of 0.72 versus 0.15) when using R58E02-GAL4 (Liu et al., 2012), a strong GAL4 driver expressed in ~90 PAM cluster DANs that includes all of the ~50 DANs that have expression in MB043C, MB213B and MB315C+MB109B. To facilitate comparison of PI magnitudes, the sign of the PI in this and subsequent panels was reversed for DANs that induced aversive memory (MB320C, MB099C and MB630B). The bottom and top of each box represents the first and third quartile, and the horizontal line dividing the box is the median. The whiskers represent the 10th and 90th percentiles. N = 8–16. Right: Comparison of the effect of training time on memory formation induced by activation of different DANs. Ratios of the mean PI obtained with short training and individual PIs obtained with long training are shown for each driver. Asterisk indicates significance of depicted pairs after comparing all pairs. (C) Comparison of learning after single and repetitive training using the three drivers MB320C, MB099C and MB630B. Either a single training with memory test after 1 min (immediate memory; left) or 10 trainings separated by 15 min resting intervals and then memory tests after 1 (middle) or 4 (right) days were used. Significant aversive 1-day memory was seen with all drivers, while 4-day memory was observed only with MB099C and MB630B. MB320C failed to show 4-day memory despite displaying the most robust immediate memory, while MB630B did not induce significant immediate memory. N = 8–12. Asterisk indicates significance of comparison of indicated pairs in B and from 0 in C: *p<0.05; **p<0.01; ***p<0.001.

DOI: http://dx.doi.org/10.7554/eLife.16135.006

Figure 2.

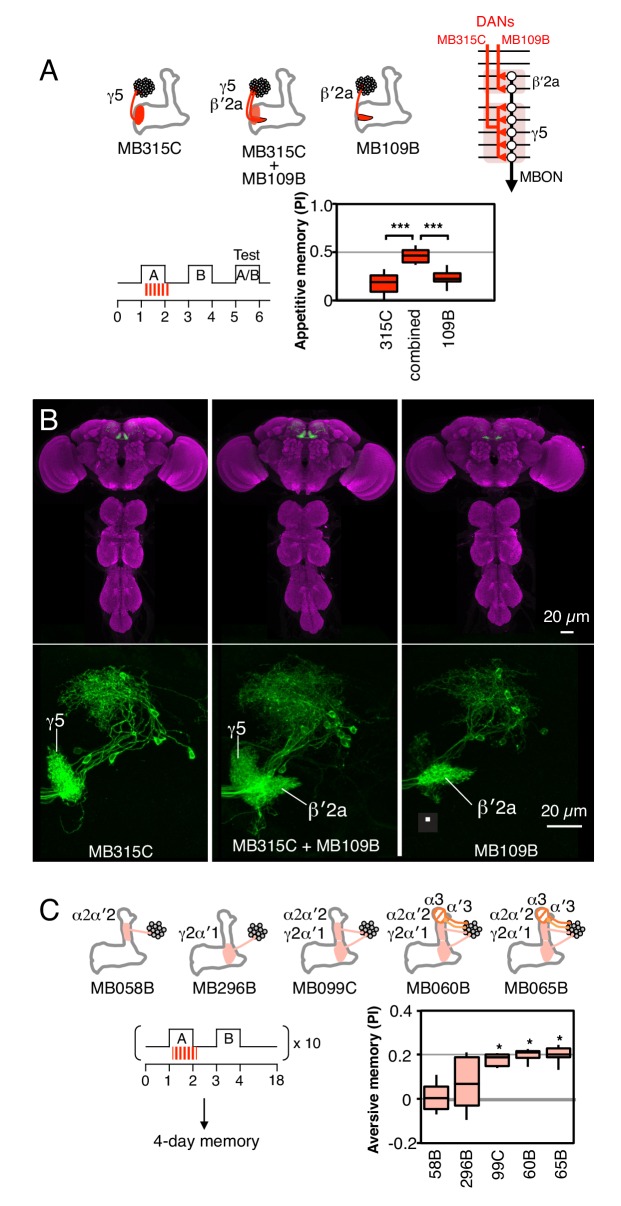
Figure 2—figure supplement 1. Combinatorial roles of DANs in memory formation.

Figure 2—figure supplement 1.

(A) Top: Diagram of the expression patterns of PAM-γ5 (MB315C) and PAM-β′2a (MB109B) as well as that obtained by combining them. As illustrated in the circuit diagram, each of these DANs innervates one of two compartments that are spanned by a common MBON. Bottom: Activating the combined drivers induced significantly higher appetitive memory than obtained by activating either driver alone. N = 12–16. (B) Top: Expression patterns of CsChrimson-mVenus (green) and the reference pattern of anti-Brp (magenta) in the brain and ventral nerve cord of the indicated split-GAL4 drivers. The expression pattern of the combined driver was nearly the simple sum of individual drivers MB109B and MB315C. Bottom: Higher magnification views of the region including the MB lobes in one brain hemisphere are shown without the reference anti-Brp pattern. (C) Training ten times with 15-min rest intervals (10x spaced training) resulted in significant 4-day aversive memory when using the three drivers, MB099C, MB060B and MB065B that express in the combination of the γ2, α′1, α′2 and α2 compartments (PPL1-γ2α′1 and PPL1-α′2α2). MB060B and MB065B also express in α3 and α′3 (PPL1-α3 and PPL1-α′3). Drivers expressing either in just α′2 plus α2 (MB058B) or just in γ2 plus α′1 (MB296B), failed to induce 4-day memory. N = 6–10. Asterisk indicates significance from 0: *p<0.05; ***p<0.001.
Figure 2—figure supplement 2. Additional drivers that induced weak, but significant, memory.
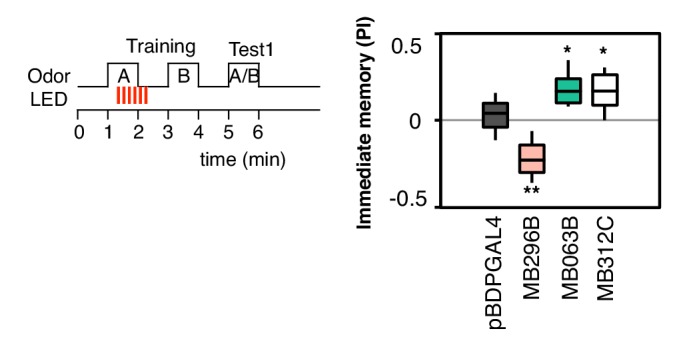
Figure 2—figure supplement 2.

pBDPGAL4 is an enhancerless GAL4 driver used as a control. MB296B expresses in PPL1-γ2α′1, a subset of the expression pattern of MB099C, and MB063B expresses in PAM-β1, a subset of the expression pattern of MB213B (Aso et al. 2014a). These drivers show significant memory compared to the control genotype, but much weaker than the combination lines (MB099C and MB213B; see Figure 2B) used in our main experiments. MB312C (Aso et al. 2014a) expresses in a combination of PAM-γ4 and PAM-γ4 < γ1γ2. N = 16–20.
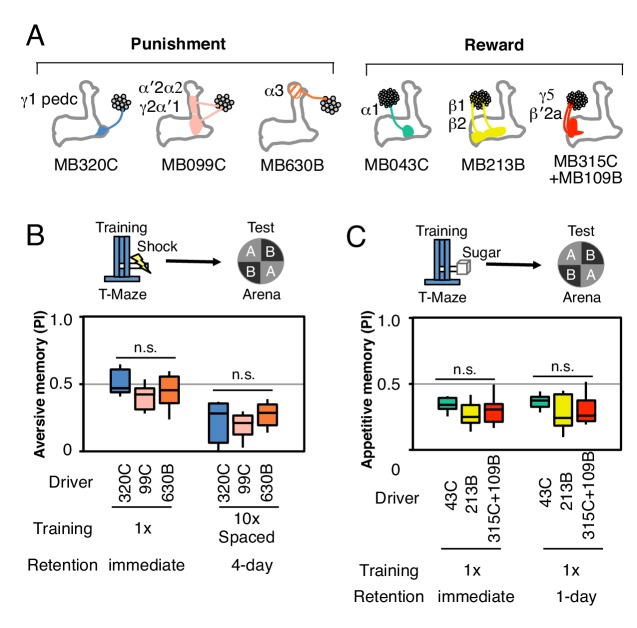
Figure 2—figure supplement 3. Controls for genetic background.

Figure 2—figure supplement 3.

(A) Diagram of the key split-GAL4 lines used in this study. (B) MB320C, MB099C and MB630B were tested as heterozygotes with UAS-CsChrimson for their ability to form aversive memory with electric shock (twelve 1.25 s pulses of 60V delivered in a shock tube) as the US rather than optogenetic stimulation and then tested in our standard arena. Both immediate memory with a single training (n = 10–12) and 4-day memory (n = 8) with 10X spaced training were assessed. (C) Similarly, MB043C, MB213B and MB315+MB109B were tested for immediate (n = 10–12) and 1-day (n = 8) appetitive memory using sugar reward as the US. The results show that all lines show roughly similar levels of memory formation, indicating that the failure to form some types of memory by optogenetic stimulation of a specific DAN is unlikely to be due to differences in genetic background between lines.
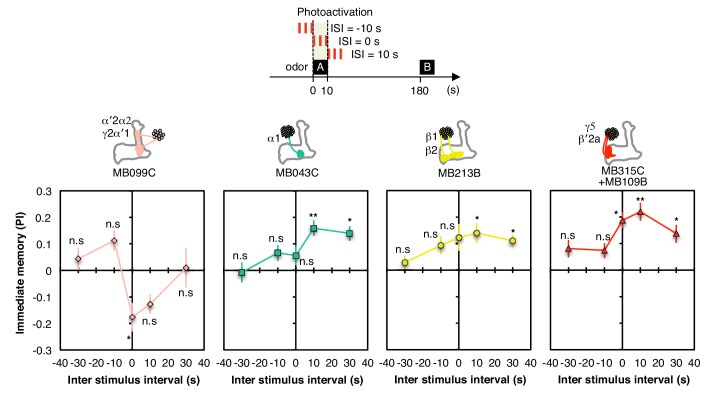
Figure 2—figure supplement 4. Inter stimulus interval curves.

Figure 2—figure supplement 4.

Inter stimulus interval curves were measured as in Figure 1G. MB099C showed significant aversive memory only at ISI = 0 s; ISI = −10 s and +10 s were significant without correction for multiple comparisons. MB043C, MB213B and MB315C+MB109B all showed significant appetitive memory at ISI = +10 s and +30 s; MB315C+MB109B also showed significant appetitive memory at ISI = 0. Thus, for appetitive memory, the period when dopamine signaling resulted in the most robust memory formation was shifted slightly later relative to odor presentation; such a response profile might be an adaptation to the time required for converting ingested food to a nutritional reward signal. The lower PIs observed relative to those shown in Figure 3B presumably result from the need to use a 10-s (rather than a 60-s) training time in these experiments. N = 8–12.
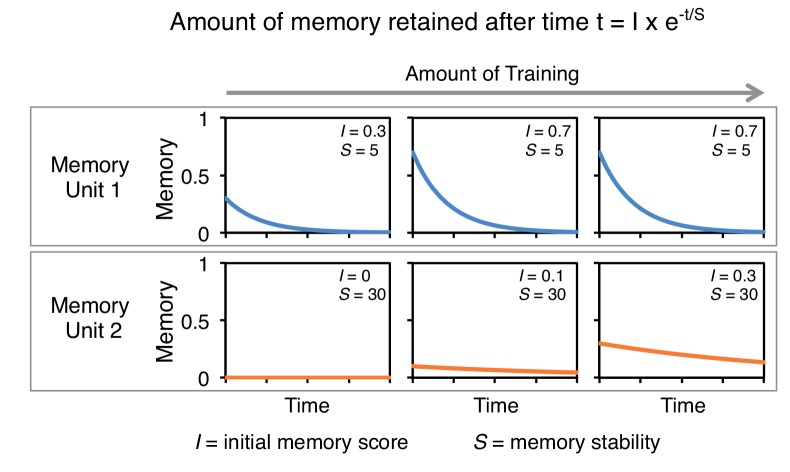
Figure 2—figure supplement 5. A conceptual model of memory dynamics in parallel memory units.

Figure 2—figure supplement 5.

The top and bottom panels show hypothetical retention curves following three different extents of training in two memory units: memory unit one has a fast acquisition rate and fast decay dynamics (top) and memory unit 2 has a slow acquisition rate and slow decay dynamics. Memory retention at certain time t is a function of the initial magnitude of memory following training, I, and the memory stability, S (Ebbinghaus, 1885). Note that while the initial memory score (I) depends on the amount of training, memory stability (S) is constant in each memory unit and is not altered by the amount of training. Based on this and previous studies (Hige et al., 2015; Aso et al., 2012), we propose that to a first approximation individual MB compartments can be modeled as distinct memory units with different baseline acquisition rates and memory stabilities, which can be set independently. For aversive memory, we found memory stability and acquisition rate appear negatively correlated (Figure 2 and Figure 3B). However, stable appetitive memory can be induced by brief training (Figure 3B) (Yamagata et al., 2015; Huetteroth et al., 2015).