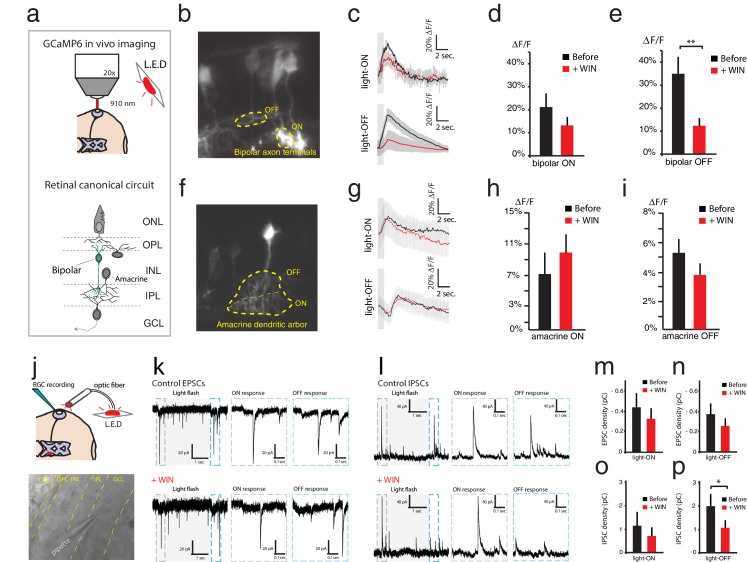
Figure 3. WIN 55,212-2 reduces some synaptic input strength onto RGCs.
(a–i) In vivo imaging of GCaMP6s expressed in the retina was used to measure Ca2+ influx at synaptic terminals of bipolar and amacrine cells. (a) Schematic representation of the imaging configuration and retinal circuitry showing bipolar and amacrine cell type locations. (b) GCaMP6s expressed in bipolar cells, with ROIs exemplifying ON- and OFF-specific bipolar axon terminals. (c) Average calcium responses of individual bipolar axon terminal to 10 light-ON (top) or 10 light-OFF (bottom) flashes before (black) and after (red) WIN 55,212-2 perfusion. (d) △F/F peak amplitudes in bipolar axon terminals (n = 10 terminals from four animals) to light-ON before and after WIN 55,212-2 perfusion (p=0.17). (e) A significant change in △F/F peak amplitude of bipolar axon terminals (n = 10 terminals from four animals) was observed to light-OFF following WIN 55,212-2 perfusion. (f) GCaMP6s expressed in amacrine cells, with ROI exemplifying ON- and OFF-specific terminals. (g) Average calcium responses of amacrine cell terminals to 10 light-ON (top) or 10 light-OFF (bottom) flashes before (black) and after (red) WIN 55,212-2 infusion. (h) No change (p=0.36) in △F/F peak amplitude was observed in amacrine cell terminals (n = 10) to light-ON before and after WIN 55,212-2 infusion. (i) △F/F peak amplitude in amacrine cell terminals (n = 10) to light-OFF stimulation was also unchanged (p=0.48) by WIN 55,212-2 perfusion. (j–p) Voltage-clamp recordings of RGCs in vivo (n = 7) during light stimulation. (j) Schematic representation of whole cell RGCs recording configuration with light stimulation driven by red LED flashes conveyed to the eye through an optic fiber. (k) left: Voltage clamp raw trace recordings of EPSCs from an RGC held at −65 mV, evoked in response to a 3 s light flash. Right: inset of the raw trace showing fast inward currents in response to light. (l) left: Trace of IPSCs from RGC held at 0 mV, evoked in response to a 3 s light flash. Right: inset of the raw trace showing fast outward currents in response to light. (m–n) Average total integrated inward current responses to light-ON (m) or light-OFF (n) flashes before (black) and after (red) WIN 55,212-2 perfusion with RGCs held at −65 mV. N = 10, p=0.025 for simple effect of WIN application by two-way ANOVA. (o–p) Average total integrated outward current responses to light-ON (o) or light-OFF (p) flashes before (black) and after (red) WIN 55,212-2 addition with RGCs held at 0 mV. n = 10, *p<0.05, **p<0.01, two-way RM ANOVA with Holm-Sidak post-test. EPSC, Excitatory postsynaptic current; IPSC, Inhibitory postsynaptic current; RGC, Retinal ganglion cell; ROI, Regions of interest.

